
TL;DR
Four PCAP files, one Wireshark window, and a chain of small questions that turns out to be a full attacker lifecycle: SSH data exfiltration, Trickbot command and control, cryptomining on odd ports, and DNS tunneling. The lab looks like a Wireshark tutorial at first. It is really a test of whether you can pick the right statistics view, read the right column, and pivot packet evidence into VirusTotal, AbuseIPDB, and MITRE ATT&CK without guessing.
Scenario

Investigate some simple network activity in Wireshark! You can launch Wireshark in a terminal with the command ‘wireshark’. The questions are mapped to the four PCAPs on the Desktop.
The investigation
PCAP One: the SSH session
Question (3 points). What remote IP address was used to transfer data over SSH? (Format: X.X.X.X)
Answer: 35.211.33.16
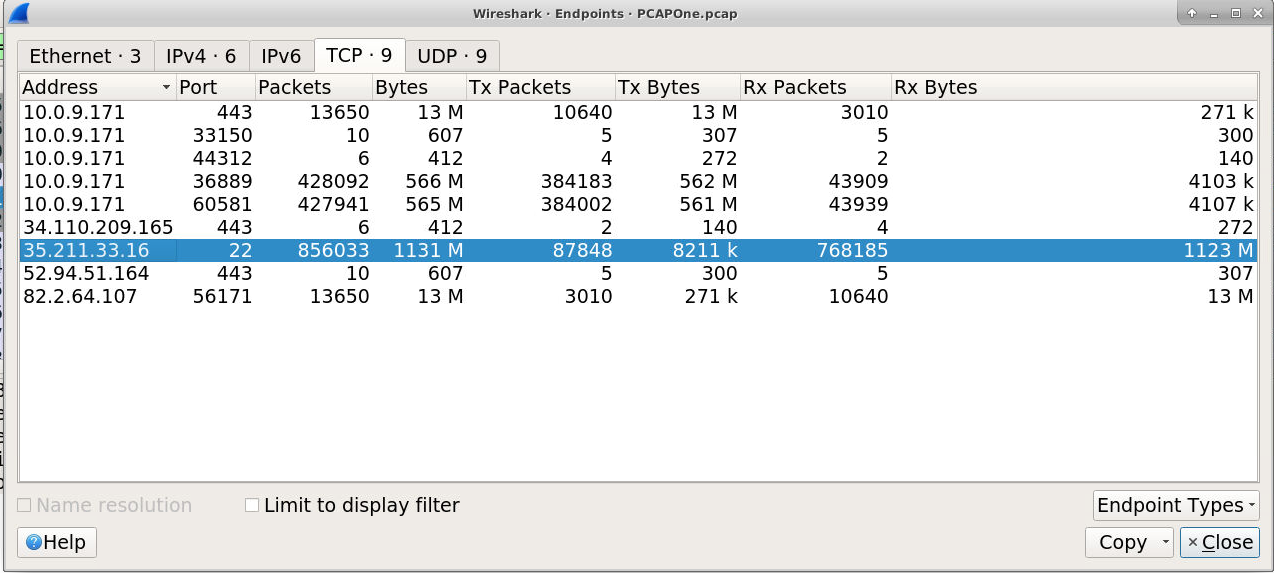
How I got there. I opened Statistics > Endpoints and switched to the TCP tab, so every address shows with the port it used. One row stood out right away: 35.211.33.16 on port 22, with 85,603 packets. Nothing else in the capture came close on volume, which confirmed the SSH session was the one the question meant.
PCAP One: total data transferred
Question (3 points). How much data was transferred in total? (Format: XXXX M)
Answer: 1131 M
How I got there. Same Endpoints view, same row. I first wrote down 1123 M from the Rx Bytes column. The catch is that the TCP tab splits traffic per direction: Tx Bytes is what the workstation sent, Rx Bytes is what it received, and the plain Bytes column is the conversation total. The lab wants the total, so the answer is 1131 M.
Correction. My original note said 1123 M. That number is the Rx Bytes value, only the traffic received from the SSH server. The row total in the Bytes column reads 1131 M, which is what the question asks for. Both writeups I verified against agree: Piggy BTLO Walkthrough and BTLO Piggy write-up.
PCAP Two: the malware family
Question (3 points). Review the IPs the infected system has communicated with. Perform OSINT searches to identify the malware family tied to this infrastructure. (Format: MalwareName)
Answer: Trickbot
How I got there. Statistics > Endpoints again, this time to list every IP the infected host talked to. I pivoted the external addresses into VirusTotal and read the community comments. The infrastructure came back tagged as Trickbot command and control.
PCAP Three: unusual ports and ASNs
Question (3 points). Review the two IPs that are communicating on an unusual port. What are the two ASN numbers these IPs belong to? (Format: ASN, ASN)
Answer: AS63949, AS14061
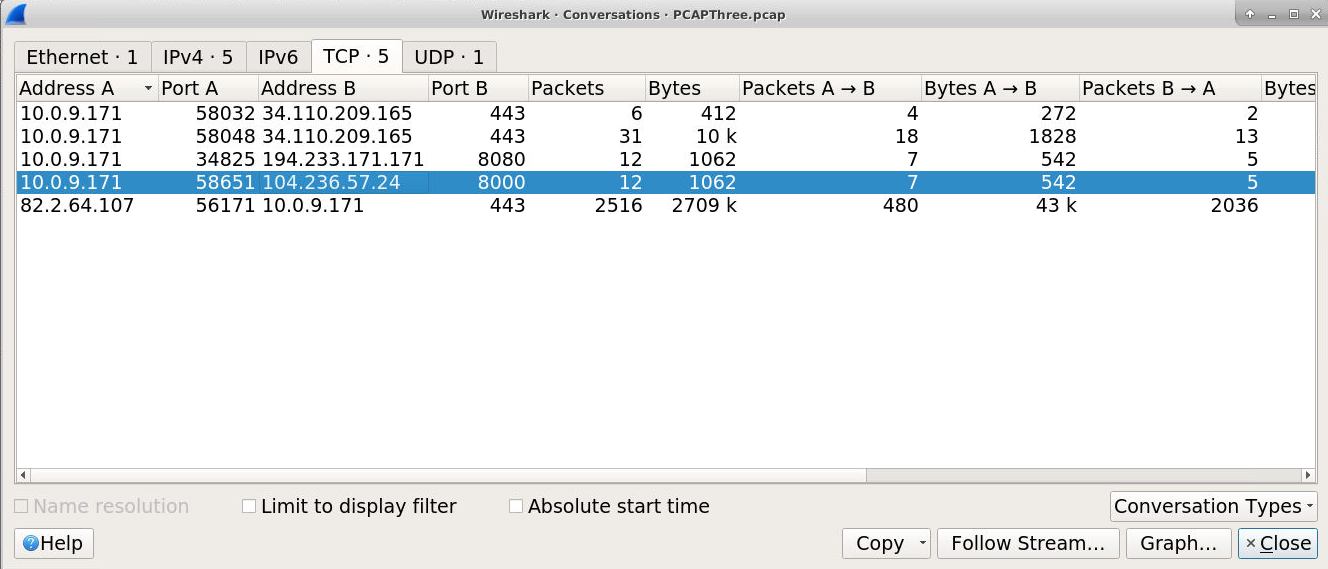
How I got there. Statistics > Conversations on PCAPThree.pcap. Almost all traffic rides 443; two conversations do not: 194.233.171.171 on 8080 and 104.236.57.24 on 8000. I looked both external IPs up in AbuseIPDB, which lists the owning ASN for each: AS63949 and AS14061.
PCAP Three: malware category
Question (3 points). Perform OSINT checks. What malware category have these IPs been attributed to historically? (Format: MalwareType)
Answer: Miner
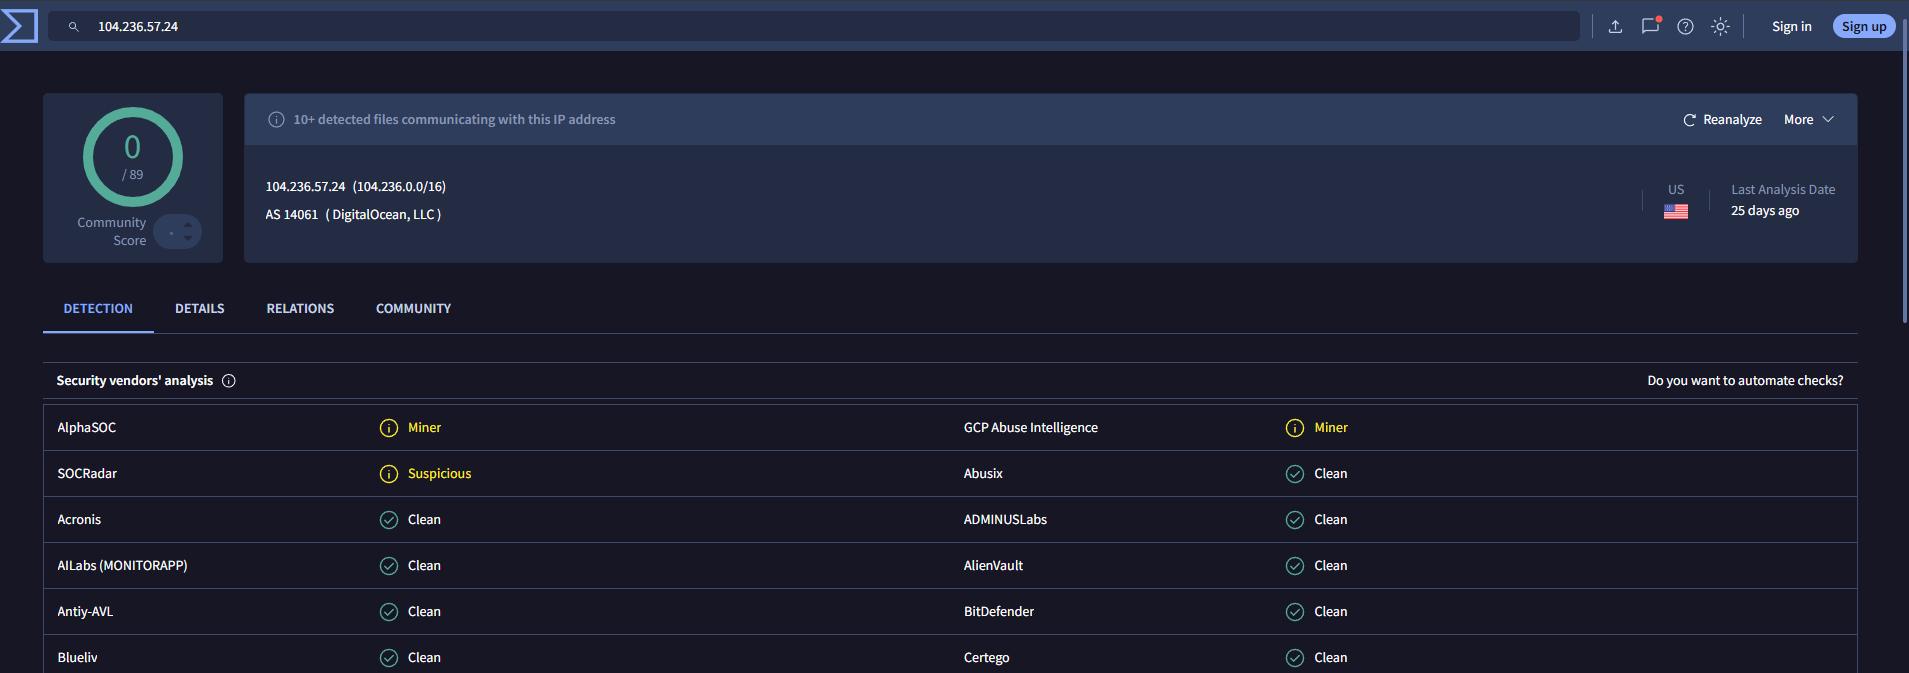
How I got there. VirusTotal on both unusual-port IPs. Detection counts were low, but the vendor tags were specific: AlphaSOC and GCP Abuse Intelligence both flag 104.236.57.24 as a Miner.
PCAP Three: the ATT&CK technique
Question (3 points). What ATT&CK technique is most closely related to this activity? (Format: TXXXX)
Answer: T1496
How I got there. With “miner” established, the mapping is nearly mechanical: unauthorized cryptomining is Resource Hijacking, technique T1496 under the Impact tactic. I confirmed it by navigating the ATT&CK site rather than trusting memory.
PCAP Four: first DNS TXT query
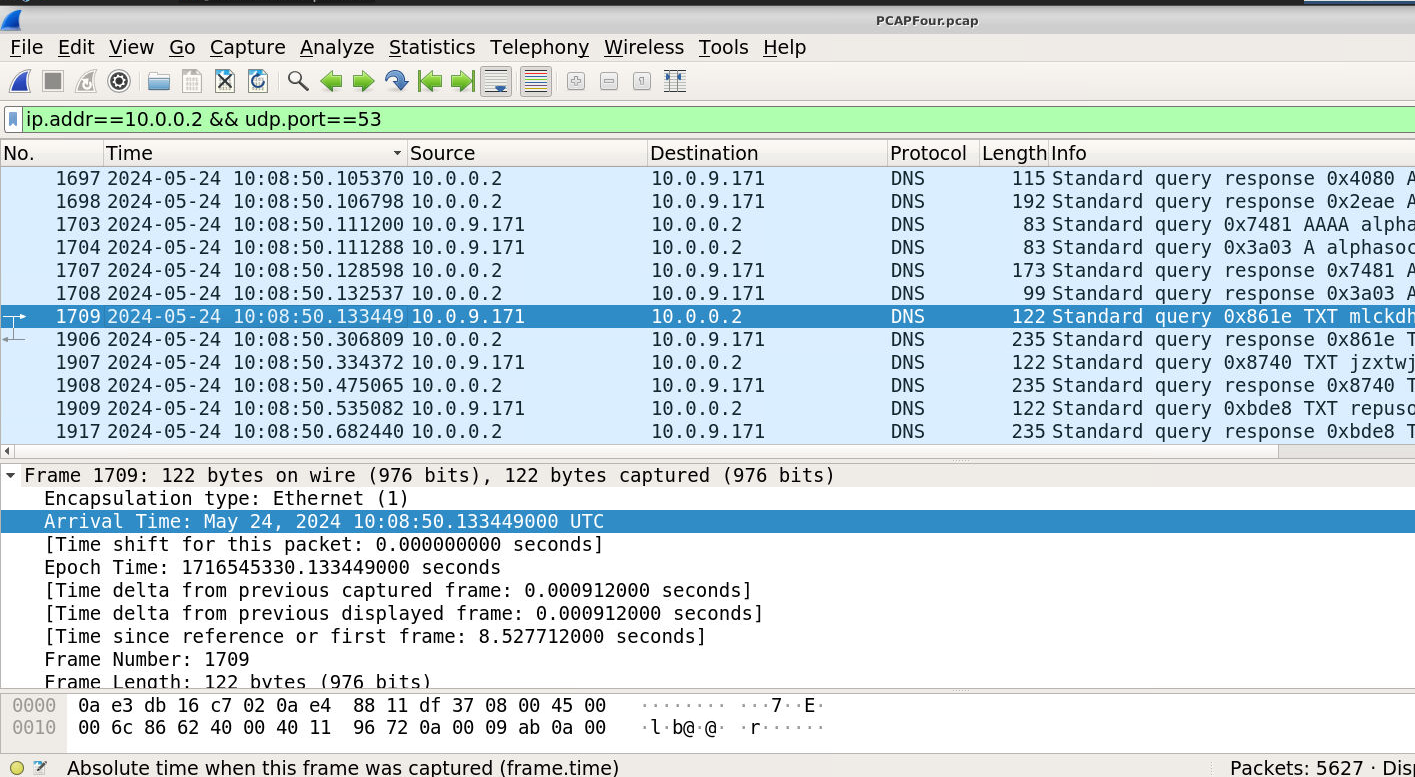
Question (3 points). Go to View > Time Display Format > Seconds Since Beginning of Capture. How long into the capture was the first TXT record query made? (Format: X.xxxxxx)
Answer: 8.527712
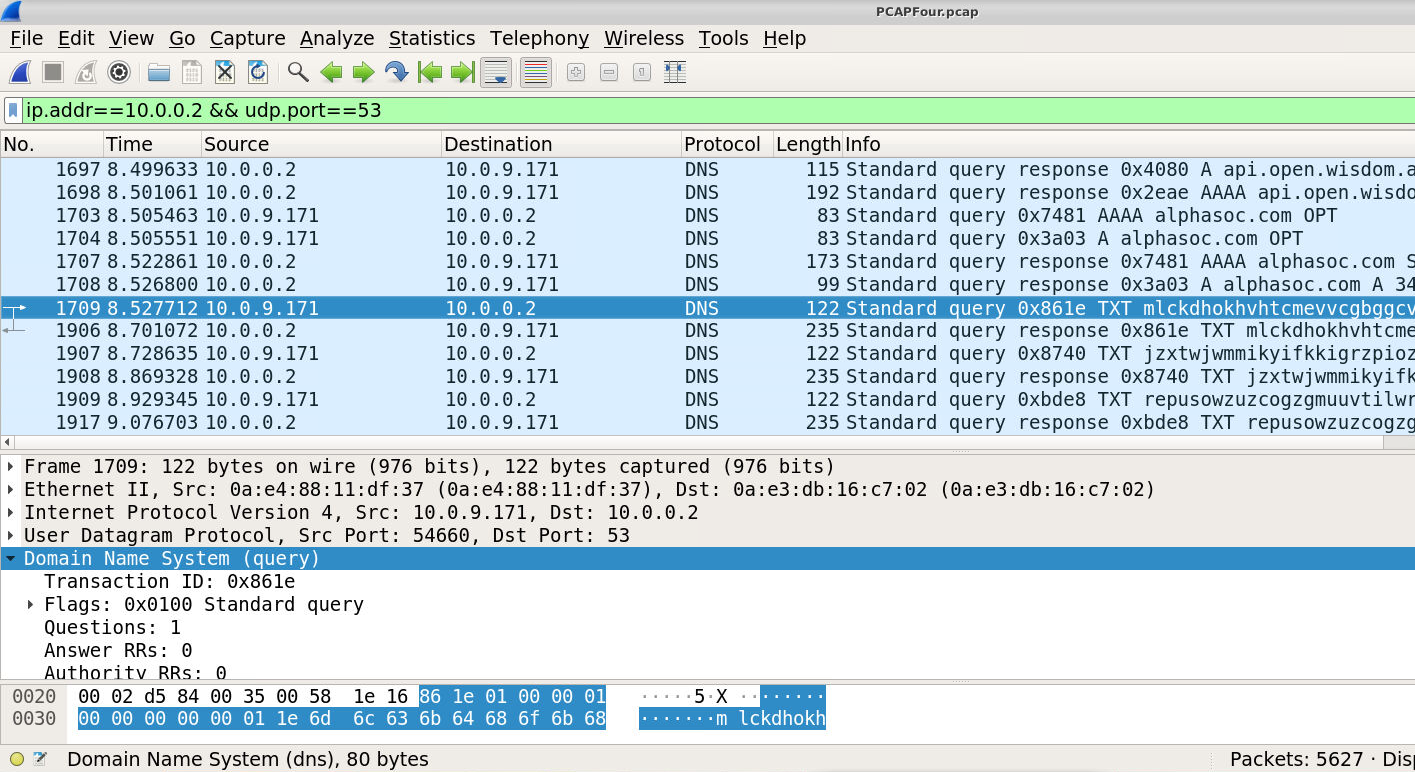
How I got there. I filtered the DNS traffic with ip.addr==10.0.0.2 && udp.port==53 and scanned for the first TXT record. Frame 1709 is it: a standard query 0x861e with a long, random-looking TXT name, at 8.527712 seconds into the capture. The detail pane confirms the query type is TXT.
PCAP Four: UTC timestamp
Question (3 points). Go to View > Time Display Format > UTC Date and Time of Day. What is the date and timestamp? (Format: YYYY-MM-DD HH:MM:SS)
Answer: 2024-05-24 10:08:50
How I got there. Same filter, same frame 1709, only the time display changed. The Time column reads 2024-05-24 10:08:50.133449, and the frame detail shows the arrival time in UTC. Rounded to the answer format, that is 2024-05-24 10:08:50.
PCAP Four: the ATT&CK subtechnique
Question (1 point). What is the ATT&CK subtechnique relating to this activity? (Format: TXXXX.xxx)
Answer: T1071.004
How I got there. The TXT queries carry encoded payloads to the C2 server over DNS, which is command and control and exfiltration hiding inside a protocol every firewall allows. That behavior is Application Layer Protocol: DNS, subtechnique T1071.004.
What this lab really tests
Whether you can move between packet evidence and external context without losing the thread. Every question starts in Wireshark, but half of them finish outside it, in VirusTotal, AbuseIPDB, and the ATT&CK matrix. That is the real SOC workflow: the capture gives you indicators, enrichment tells you what they mean, ATT&CK turns the finding into a reportable technique.
Skills and techniques
- Wireshark:
Statistics > Endpoints(TCP tab),Statistics > Conversations, time display formats, display filters - OSINT enrichment: VirusTotal (community tags, vendor verdicts), AbuseIPDB (ASN lookups)
- MITRE ATT&CK: T1071.004 (Application Layer Protocol: DNS), T1496 (Resource Hijacking)