
TL;DR
A Splunk hunt with no PCAPs in sight: a WayneCorpInc web server keeps talking to three AWS EC2 instances the company does not use, and the trail runs from Sysmon process and network events, to a Suricata HTTP record of the payload being uploaded through the Joomla admin panel, to VirusTotal, and back to the one alert that fired. Almost every answer is the input to the next question. What this lab really drills is pivot discipline, staying with one event across multiple log sources instead of starting fresh every time.
Scenario

Your organization doesn’t use Amazon Web Services, so when a Threat Hunter starts seeing connections to multiple EC2 instances, it’s time to start hunting to understand what happened, so the information can be passed to the incident response team, and indicators can be gathered for intelligence sharing. To start Splunk, open a terminal and run the command ‘sudo systemctl start Splunkd’, then open Firefox and navigate to 127.0.0.1:8000. At the beginning of each search query, start it with “index=*”. Also make sure you’ve set the timeframe to ‘All Time’.
The investigation
Counting the EC2 destinations
Question (3 points). WayneCorpInc doesn’t use Amazon Web Service for cloud hosting, so when a threat hunter discovered outbound connections to EC2 instances they immediately began to drill down into this activity so they can provide as much context for the Incident Response Team as possible. Using Sysmon logs, how many destination hostnames are found? (Format: # Destination EC2s)
Answer: 3
How I got there. After opening Splunk I started with what an EC2 hostname looks like. Public EC2 instances resolve to a predictable pattern:
ec2-xxx-xx-xxx-xxx.compute-1.amazonaws.comso I searched the Sysmon logs, as the question instructs, for the string aws:
index=* source="WinEventLog:Microsoft-Windows-Sysmon/Operational" sourcetype=xmlwineventlog awsThe DestinationHostname field in the results holds three distinct hostnames, all EC2 boxes.
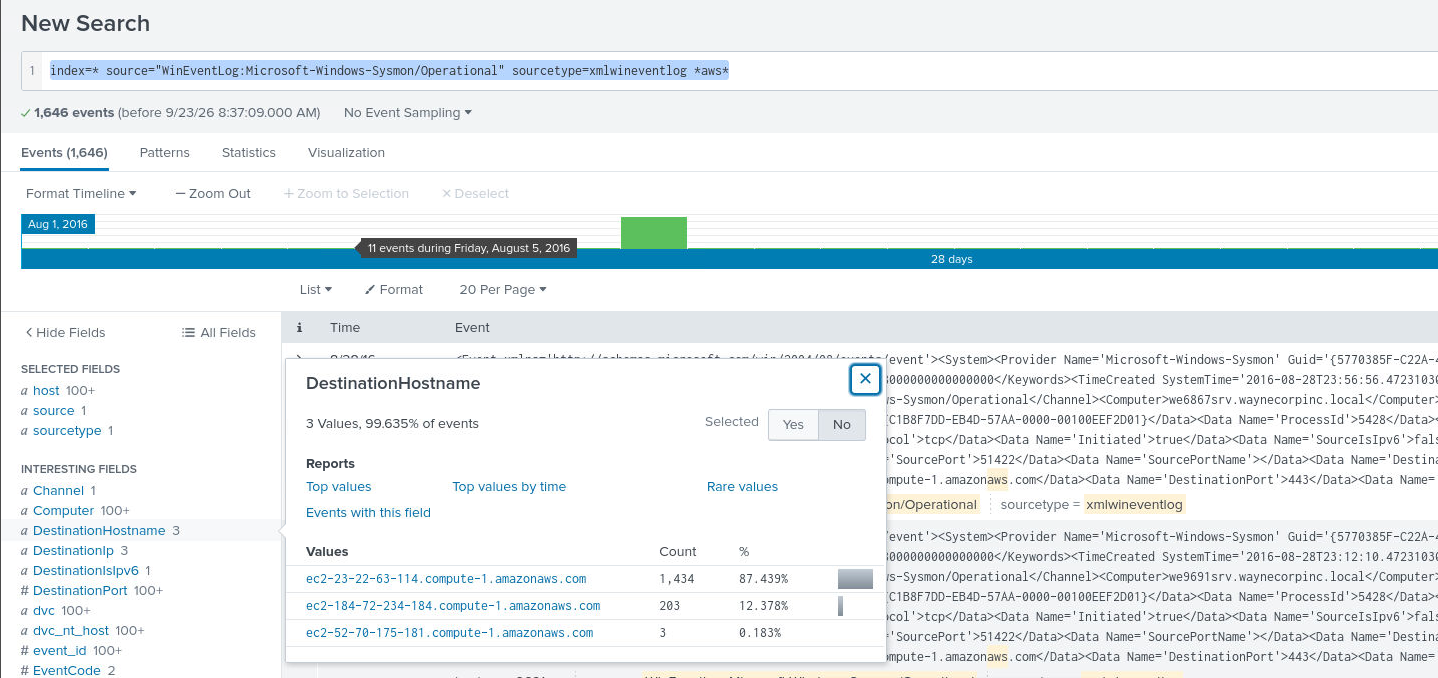
The three hostnames, ranked by event count
Question (3 points). Enter the hostnames (excluding ‘.compute-1.amazon.aws.com’) in the order of event count, with the highest first (Format: Hostname1, Hostname2, …)
Answer: ec2-23-22-63-114, ec2-184-72-234-184, ec2-52-70-175-181
How I got there. Same search, no new work needed. The interesting fields panel counts events per value of DestinationHostname, so I read the three hostnames off it in descending order and stripped the suffix the question tells me to leave out.
Which file opens these connections
Question (3 points). Look at the Image ‘interesting field’ to see what files are initiating these connections. What is the Image value with the lowest count? (Format: Image Value)
Answer: C:\inetpub\wwwroot\joomla\3791.exe
How I got there. The question names the field, so this was one click. Image in the interesting fields panel lists the files that initiated the connections, each with an event count next to it. The value with the lowest count was an executable sitting in the Joomla web root, C:\inetpub\wwwroot\joomla\3791.exe. A file like that has no business opening connections to anything.
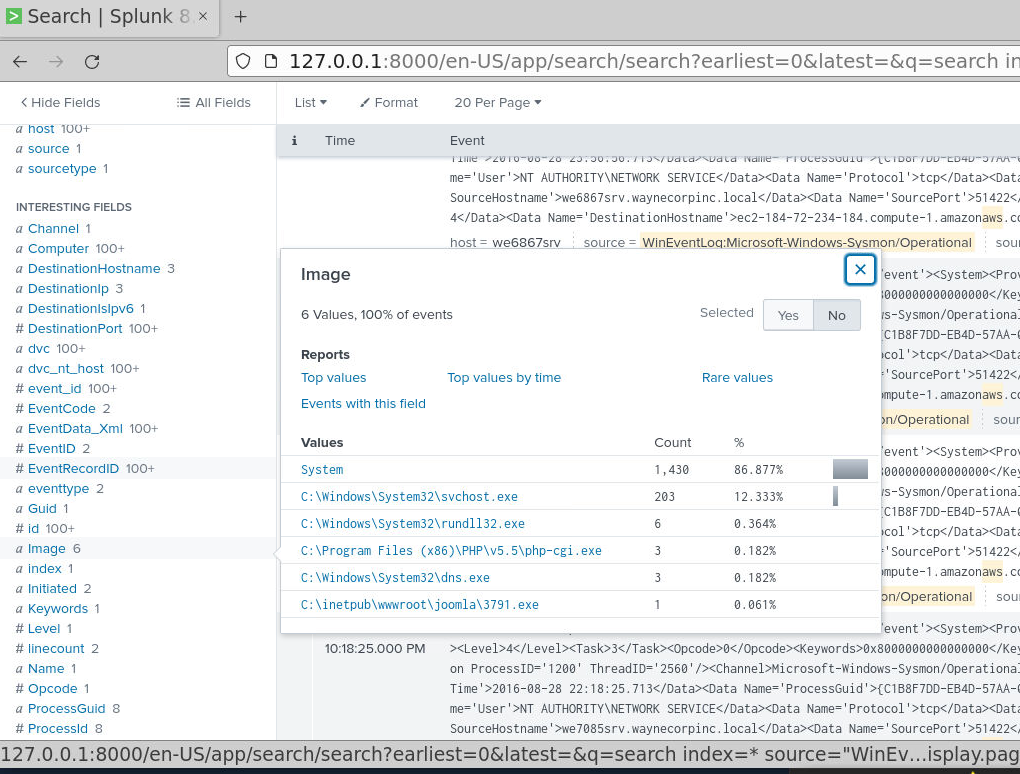
The host behind the connection
Question (3 points). What is the hostname and internal IP address of the system that initiated this connection? (Format: Hostname, X.X.X.X)
Answer: we1149srv.waynecorpinc.local, 192.168.250.70
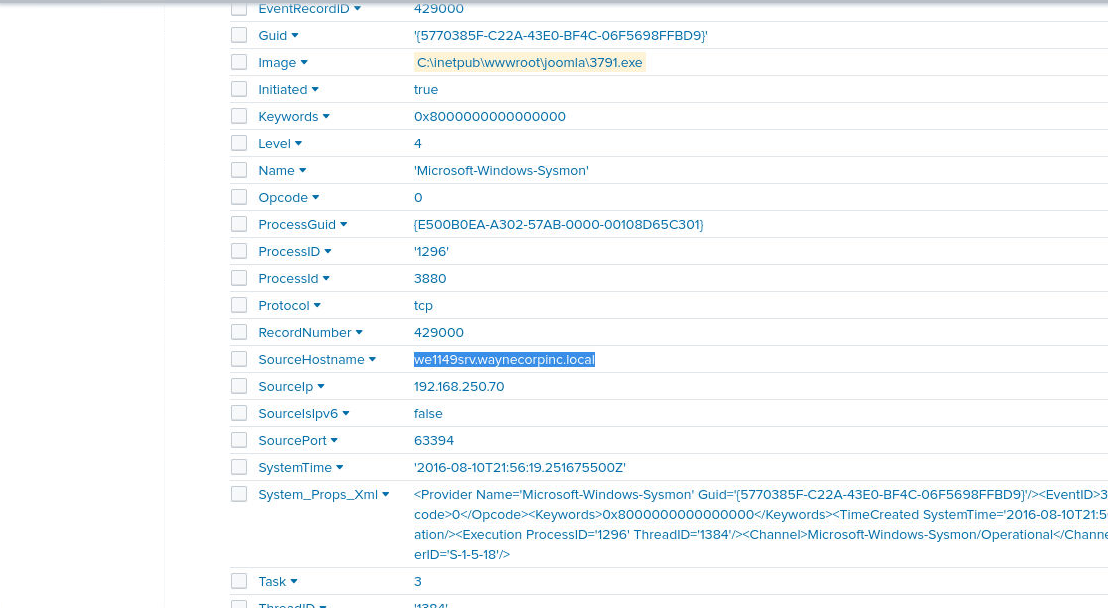
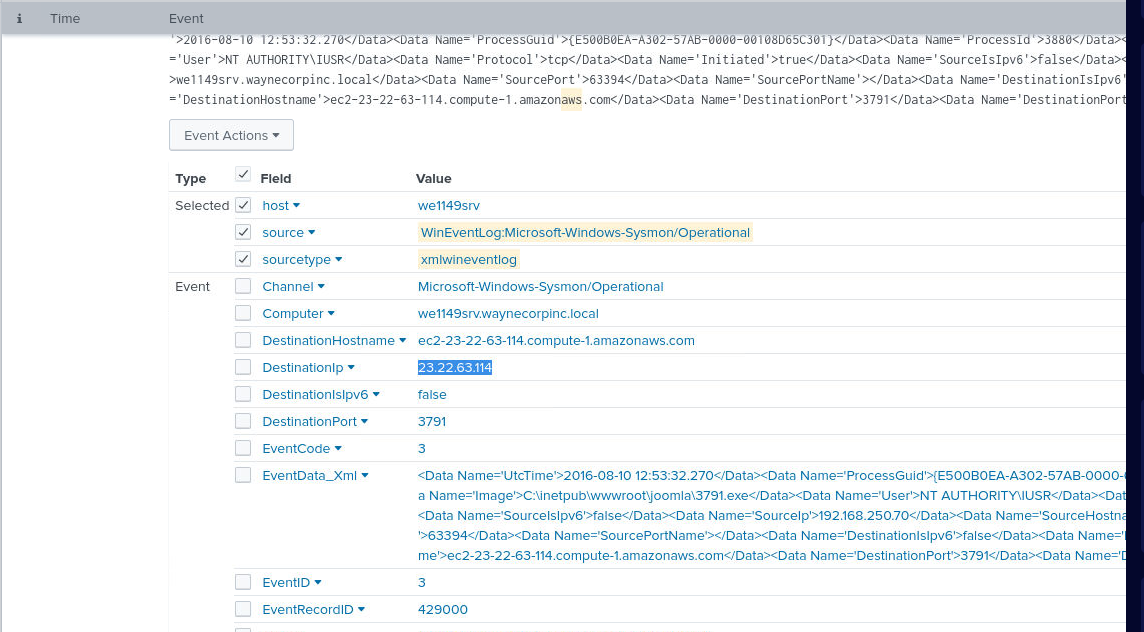
How I got there. Continuing from question 3, I expanded the event behind the lowest-count Image value and read through its fields. SourceHostname and SourceIp held the answers: we1149srv.waynecorpinc.local at 192.168.250.70. The naming gives it away on its own, we1149srv is a server, and 192.168.250.x is internal space.
When the connection happened
Question (3 points). What time was this connection event? Use TimeCreated SystemTime (Format: YYYY-MM-DDTHH:MM:SS)
Answer: 2016-08-10T21:56:19
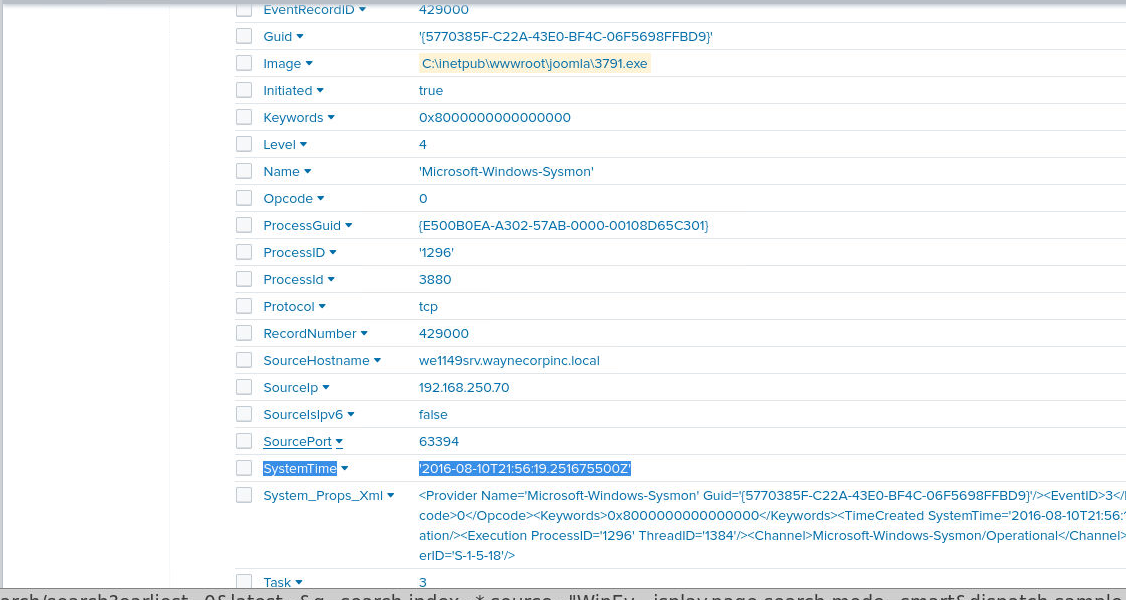
How I got there. Nothing new to run. Following where we left off, the same event clearly shows the SystemTime field the question asks for, and it reads 2016-08-10T21:56:19. That is the Windows event’s own clock, not Splunk’s _time interpretation of it.
The EC2 instance on the other end
Question (3 points). What is the destination hostname and IP address of the AWS EC2 instance? (Format: Hostname, X.X.X.X)
Answer: ec2-23-22-63-114.compute-1.amazonaws.com, 23.22.63.114
How I got there. At this point it is self-explanatory: DestinationHostname and DestinationIp in the same event give the full EC2 name and the address, ec2-23-22-63-114.compute-1.amazonaws.com at 23.22.63.114. That is also the highest-count hostname from question 2, so everything lines up.
The SHA256 of the executable
Question (5 points). Utilize Sysmon logs to find the SHA256 hash of the executable making this connection. What is the hash value? (Format: SHA256 Hash)
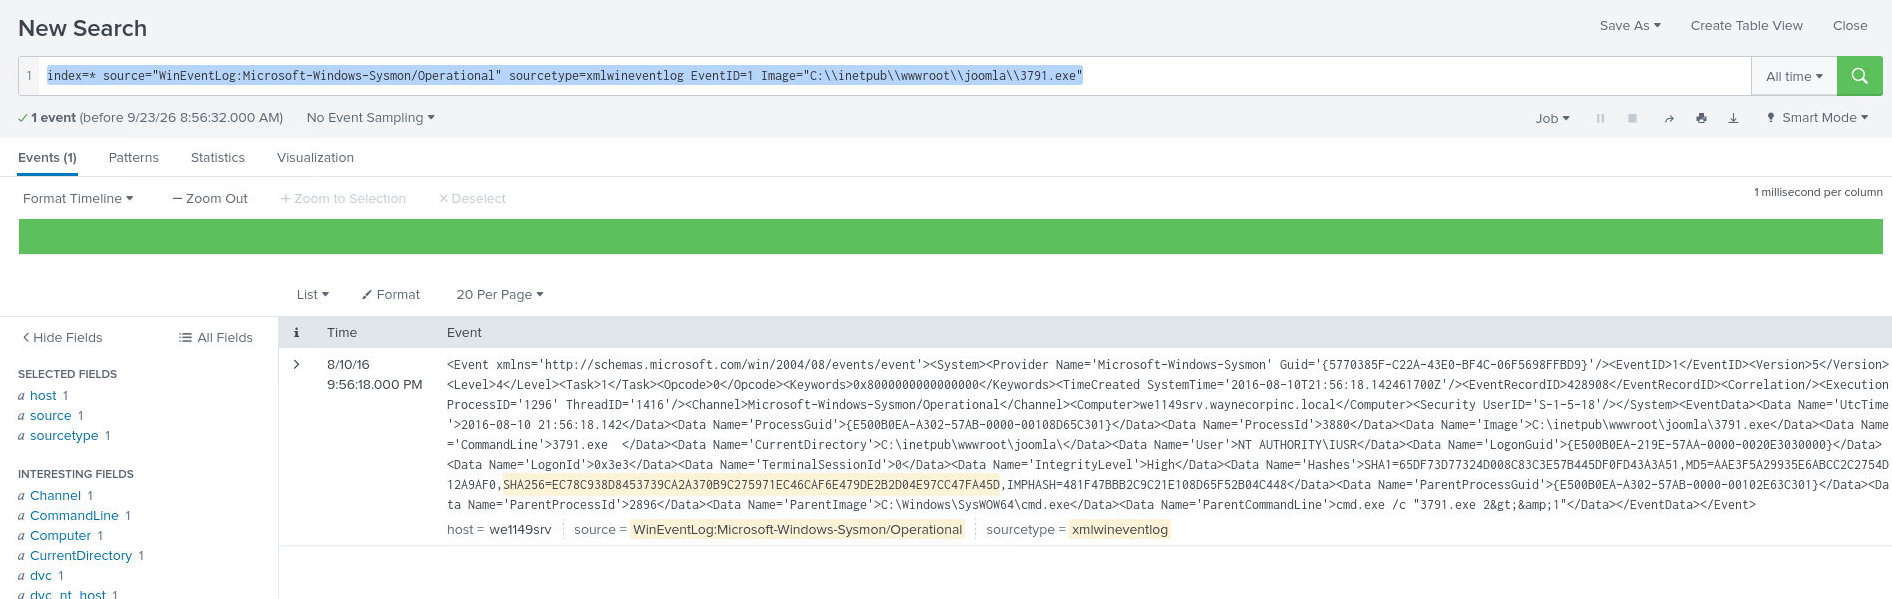
Answer: EC78C938D8453739CA2A370B9C275971EC46CAF6E479DE2B2D04E97CC47FA45D
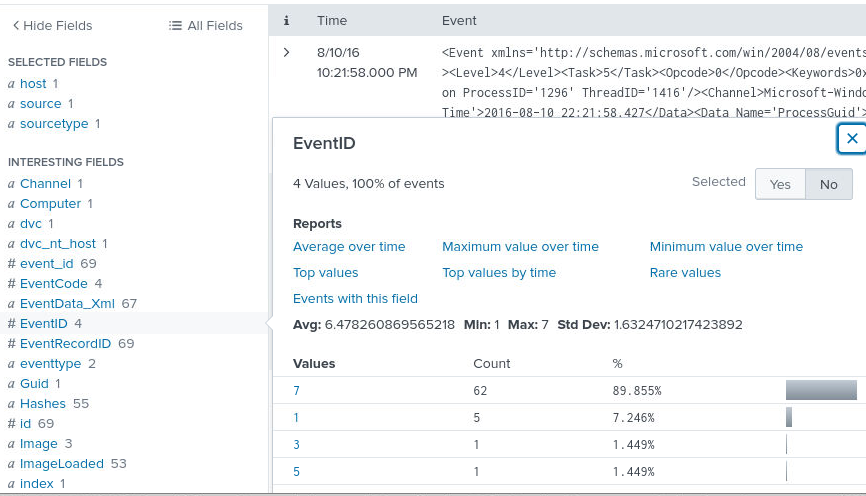
How I got there. Since the question asks for the SHA256 of an executable, there is only one Sysmon event type that provides that: event ID 1, process creation. I already had the executable’s name and path, so I adjusted the search to match:
index=* source="WinEventLog:Microsoft-Windows-Sysmon/Operational" sourcetype=xmlwineventlog EventID=1 Image="C:\inetpub\wwwroot\joomla\3791.exe"Exactly one event matched, and its Hashes field carries the SHA256: EC78C938D8453739CA2A370B9C275971EC46CAF6E479DE2B2D04E97CC47FA45D.
VirusTotal reputation and the Sysinternals contacts
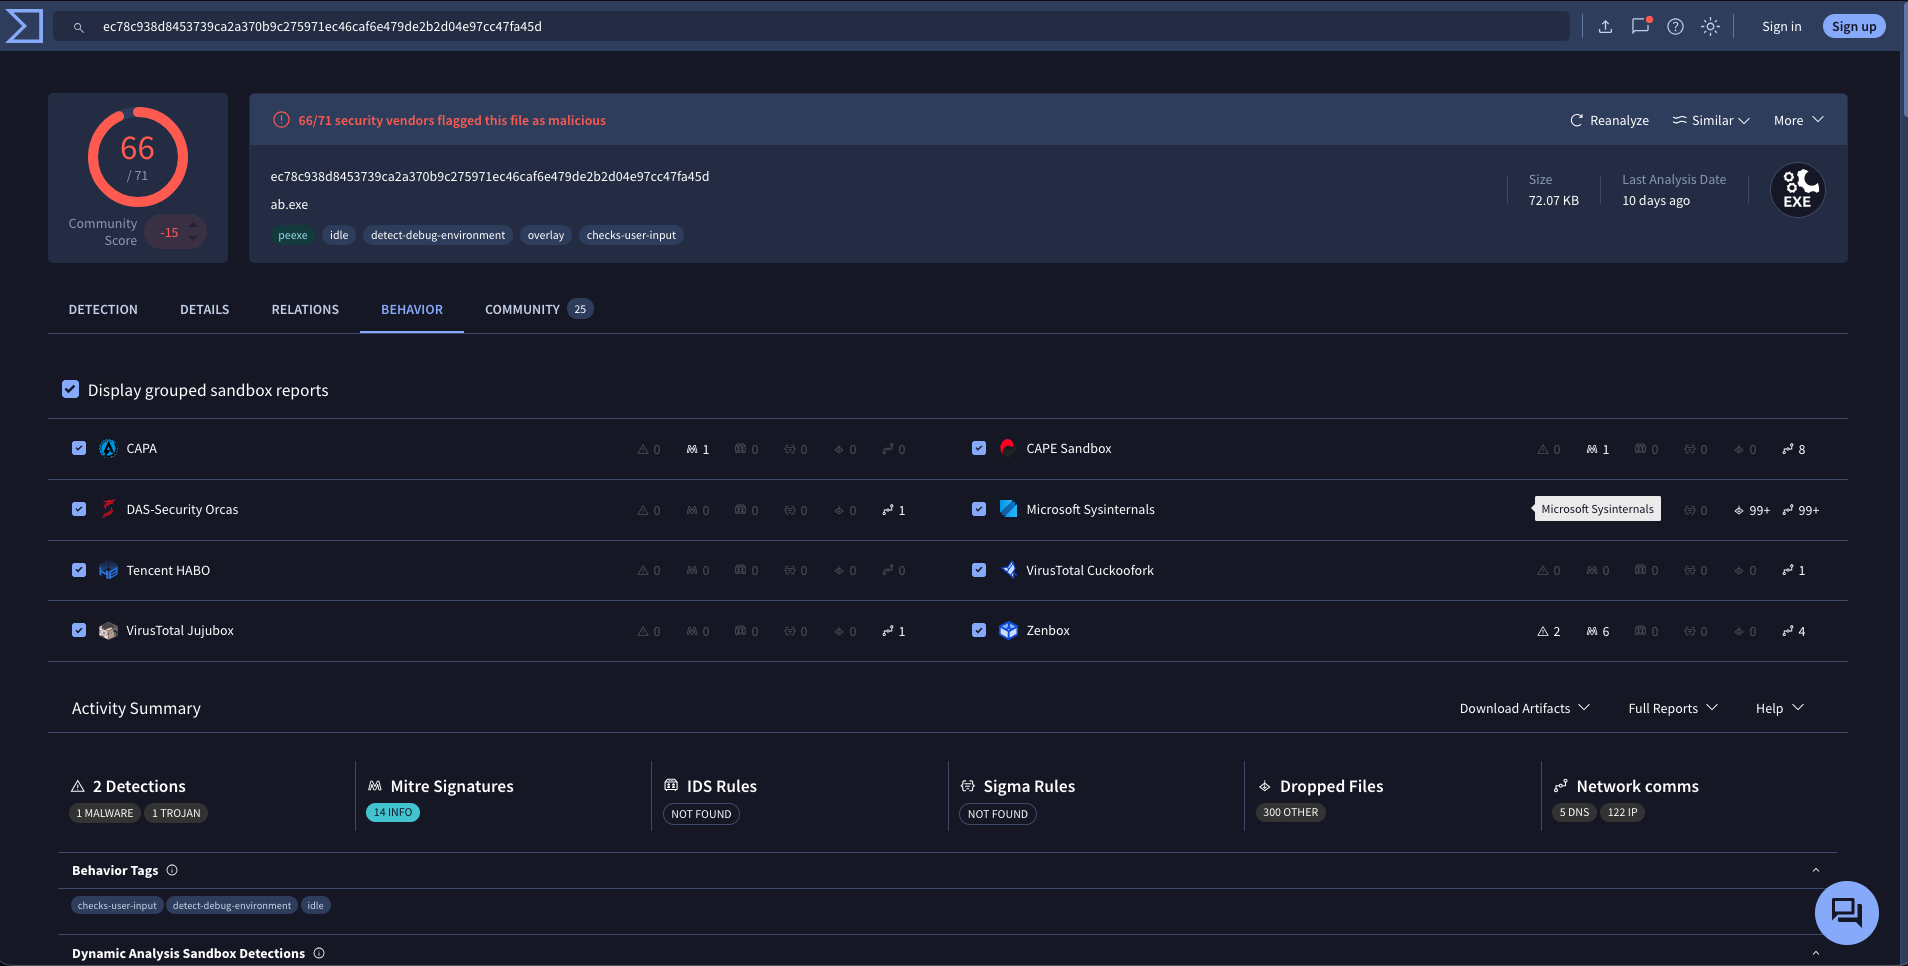
Question (3 points). Search this hash online to find more about its reputation. On the Behaviour tab look at the results for Microsoft Sysinternals. What two IPv4 addresses are listed, that begin with 23.216.? (Format: X.X.X.X, X.X.X.X)
Answer: 23.216.147.64, 23.216.147.76
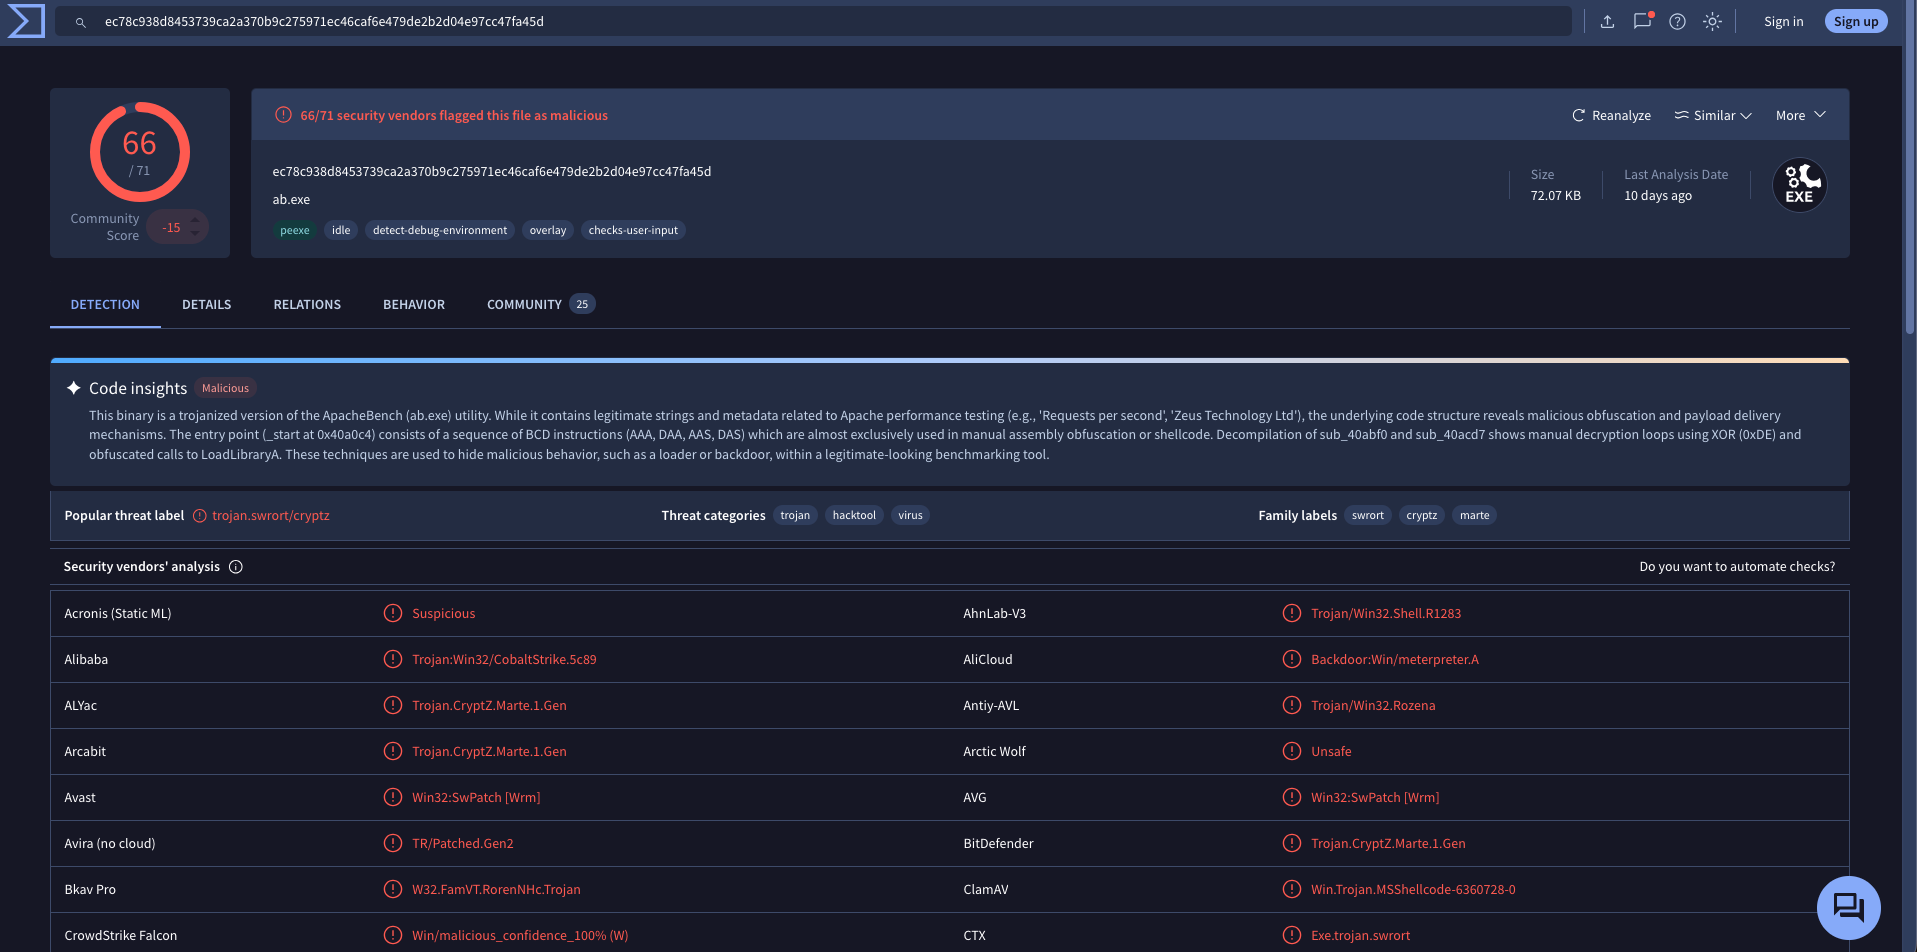
How I got there. The wording says search online, and my first instinct for anything reputation-related is VirusTotal. The hash is known there and flagged as malicious by most engines, and the crowd calls it a Trojan. So the file our web server ran is confirmed bad, not a maybe. Then I opened the Behaviour tab as instructed and scrolled to the Microsoft Sysinternals section. Two of the contacted IPv4 addresses start with 23.216: 23.216.147.64 and 23.216.147.76. One warning worth noting: the grader does not accept the pair the other way around, even though the question never asks for an order.
Hunting the two IPs across all logs
Question (3 points). Using these two gathered IPs, check to see if there is any activity from them in Splunk, which there might not be! What is the number of events per IP where the address is mentioned ANYWHERE in a log? (Format: IP1EventCount, IP2EventCount)
Answer: 0, 0
How I got there. This one finally steps up the difficulty, but the wording carries a hint. Since it says ANYWHERE in the logs, it is time to drop the Sysmon filter and search our logs to the full extent. I am not proud of this search, but slowly and surely it does the job:
index=* ("23.216.147.64" OR "23.216.147.76")
| table _time host sourcetype source EventCode EventID _raw
The search returned nothing. Having run it and seen no results across every index, the answer is 0 for both addresses.
When the file hit the web server
Question (4 points). At what time was this file uploaded to the web server? (Use ‘timestamp’ value) (Format: YYYY-MM-DDTHH:MM:SS)
Answer: 2016-08-10T21:52:47
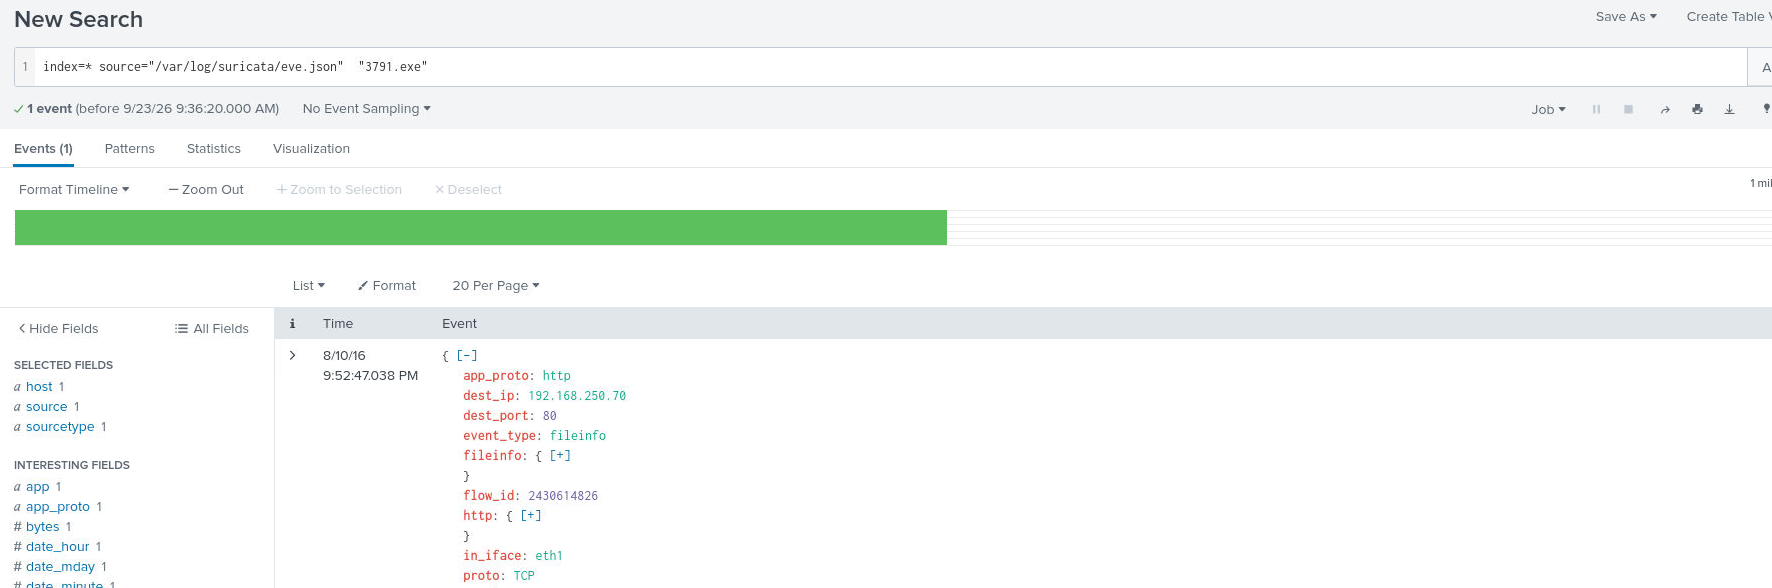
How I got there. My first thought was to search the filename in Sysmon logs; something around event ID 11, file creation, should have caught a file landing on disk. Nothing useful came back. Then I searched the image name across all Sysmon logs and struck out again. Sysmon never recorded this file arriving, so I pivoted to the other big source we have, Suricata, and searched for the filename there:
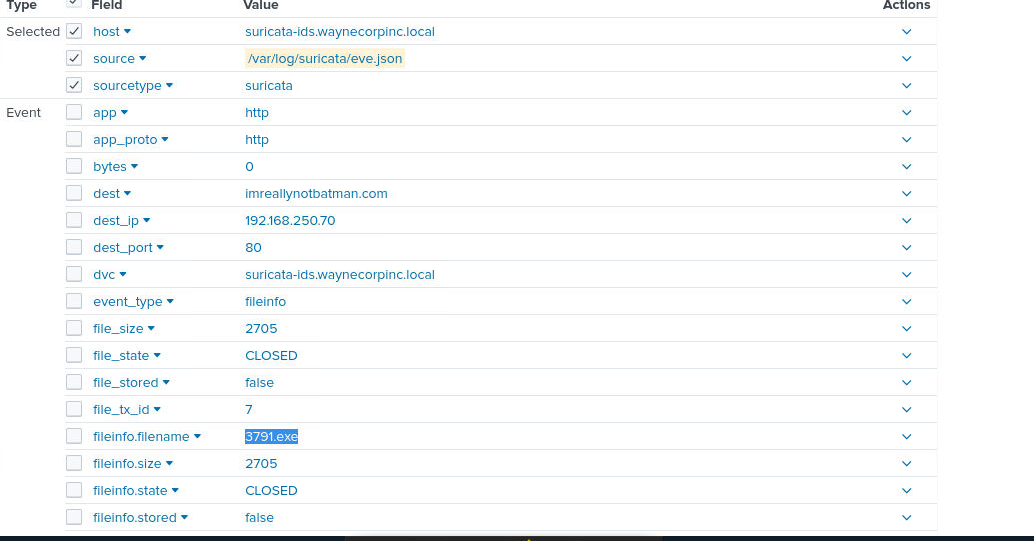
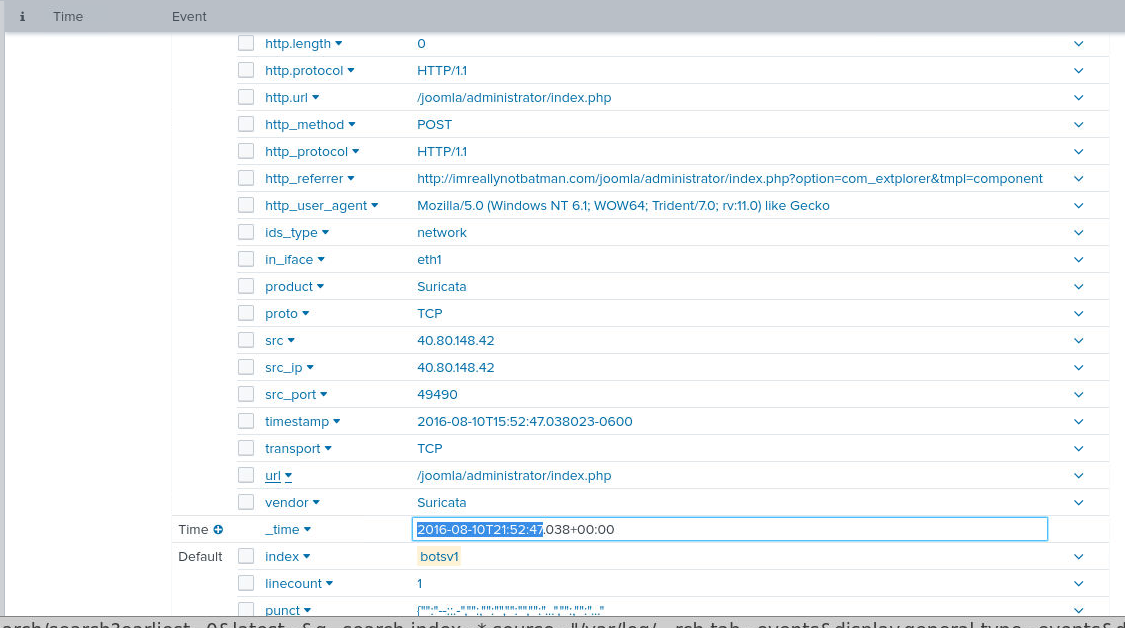
index=* source="/var/log/suricata/eve.json" "3791.exe"Great result: exactly one event, and it is an HTTP POST carrying the malware’s name, so this is almost certainly the upload itself. Its timestamp field reads 2016-08-10T21:52:47.
The uploader’s user-agent
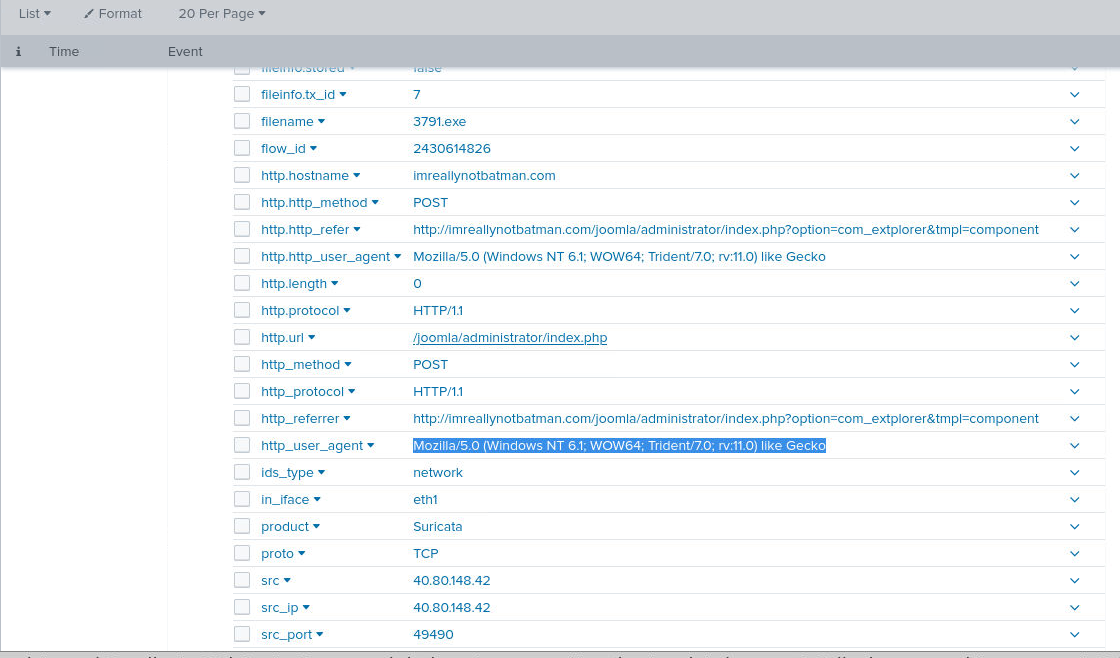
Question (4 points). What user-agent was used to upload the file? (Format: Full User-Agent)
Answer: Mozilla/5.0 (Windows NT 6.1; WOW64; Trident/7.0; rv:11.0) like Gecko
How I got there. Continuing from question 10, the same event has the field for this too. The full user-agent reads like Internet Explorer 11 on 64-bit Windows: Mozilla/5.0 (Windows NT 6.1; WOW64; Trident/7.0; rv:11.0) like Gecko.
The POST target URI
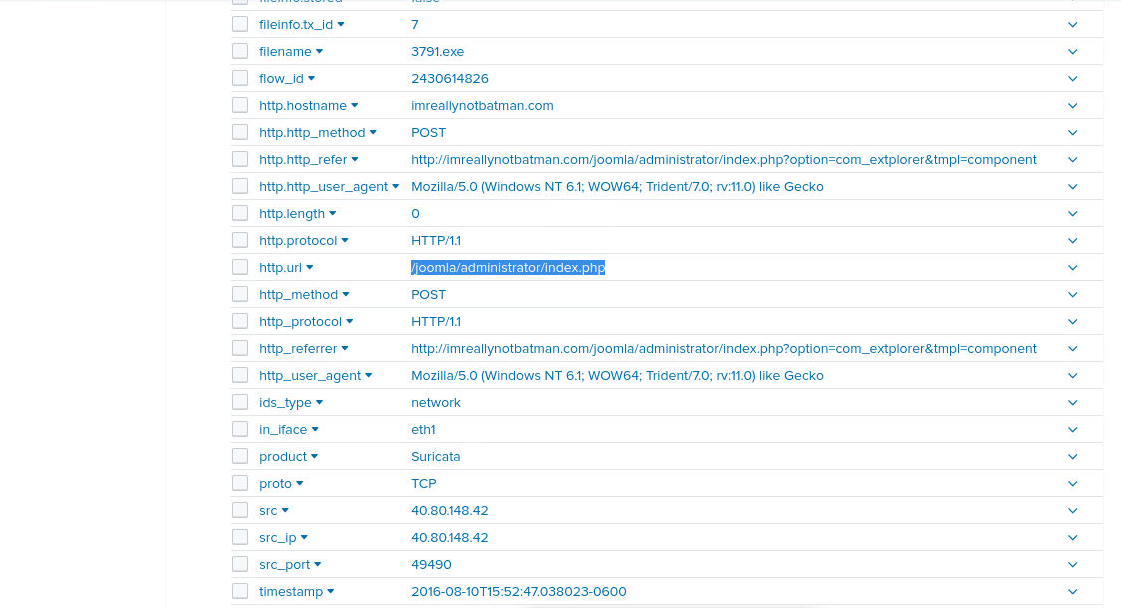
Question (4 points). What URI received a POST request from the attacker, in order to upload the file? (Format: /path/to/something)
Answer: /joomla/administrator/index.php
How I got there. For that I stayed on the same event. The URI field shows where the POST went: /joomla/administrator/index.php, the Joomla admin endpoint, which says a lot about how the file got into the web root.
The source IP behind the upload
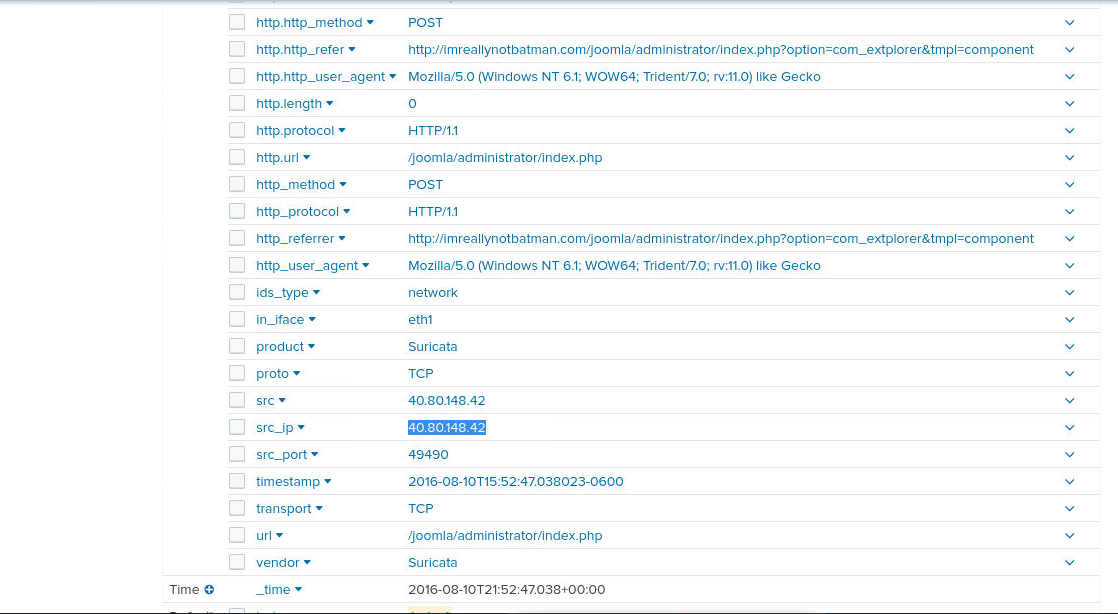
Question (4 points). What is the source IP responsible for the initial access activity? (Format: X.X.X.X)
Answer: 40.80.148.42
How I got there. Let’s look at the src_ip field. It reads 40.80.148.42, an external address, which makes it the source of the initial access activity.
Checking whether our defenses fired
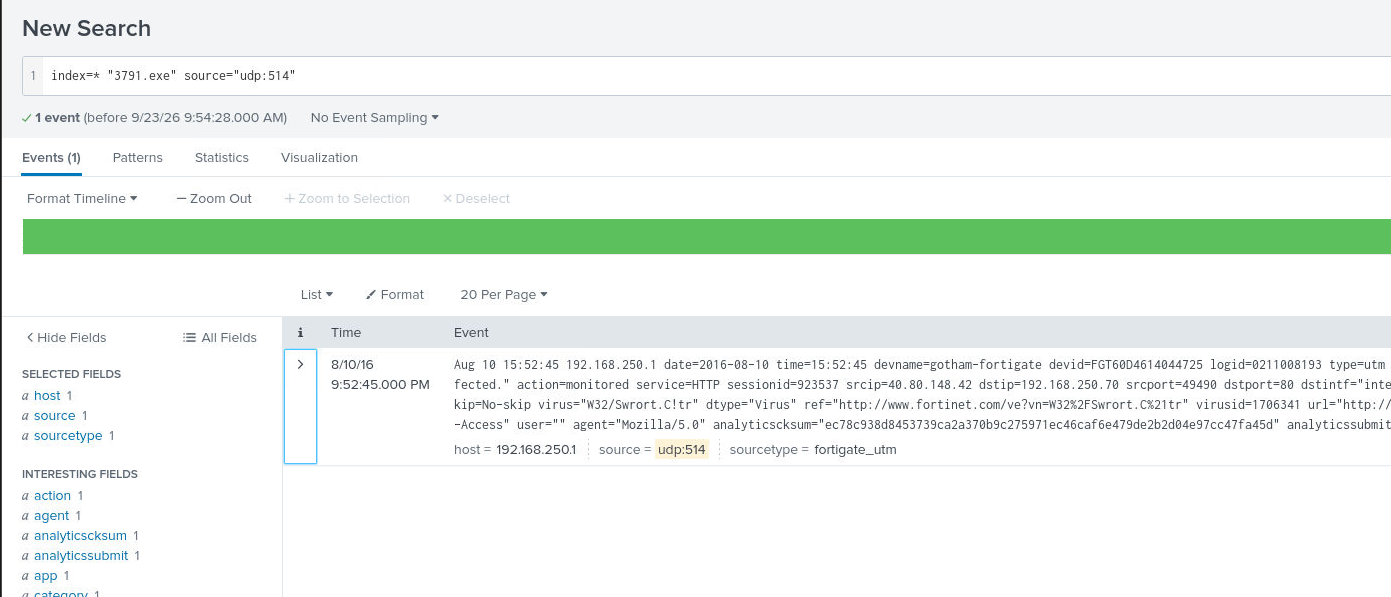
Question (5 points). We need to understand if any of our network defenses have detected this activity, or if we’re completely blind. Use one of the retrieved indicators to search the logs to see if anything has flagged this file as being malicious. Provide any timestamp retrieved from a relevant log to show evidence of some kind of alert or notification (Format: YYYY-MM-DD HH:MM:SS)
Answer: 2016-08-10 15:52:45
How I got there. My thought process went as follows: it asks for an alert on the network side, so the obvious place to look is the firewall. I searched for the malware name and set the source to only firewall logs, and got a hit. Before writing anything I opened the actual log to verify it really is an alert, because a mention is not a detection. It is one: the device has flagged 3791.exe as a malicious file, so it definitely counts. The alert’s timestamp reads 2016-08-10 15:52:45.
What this lab really tests
Threat hunting hands its work to someone else. Every question here ends in a fact the response team can act on: which host, which file, which hash, which external IP, and whether anything already alerted. The lab also punishes silo thinking twice, once when Sysmon never sees the upload that Suricata recorded, and once when a full-index search for two known-bad IPs returns the most useful zero you will ever get. That combination, pivoting forward and knowing what a negative result means, is the daily shape of the job.
Skills and techniques
- Splunk SPL: full-index keyword searches, interesting fields, expanding a single event, EventID and Image filters,
| table - Windows Sysmon: event ID 1 process creation and its Hashes field, network connection events (Image, SourceHostname, SourceIp, DestinationHostname, DestinationIp, TimeCreated SystemTime)
- Suricata eve.json: HTTP event metadata (timestamp, user-agent, URI, src_ip)
- OSINT: VirusTotal hash reputation, Behaviour tab contact IPs
- MITRE ATT&CK: T1105 (Ingress Tool Transfer) for the payload upload into the web root