
TL;DR
A Splunk CTF rather than a guided lab: fifteen questions against the BOTS v1 index, where the only way through is knowing which sourcetype holds the answer. Stream HTTP carries most of the story, Suricata and FortiGate fill the gaps, and Sysmon closes the host side. I found the scanning IP first, then followed the chain to the brute force, the uploaded executable, its hash, and finally out of Splunk entirely to ThreatMiner and VirusTotal for the spear phishing payload. The lesson that stuck: one event type, like an HTTP POST, looks completely different depending on which log it lands in.
Scenario
GCPD has found evidence online (a pastebin post) that the website www.imreallynotbatman.com, hosted in Wayne Enterprises’ IP address space, has been compromised by a group calling itself Po1s0n1vy. The group has multiple objectives, but a key part of their modus operandi is defacing websites to embarrass their victims. Alice Bluebird, the newest analyst in the Wayne Enterprises SOC, has to determine whether the site was really compromised, and reconstruct how the attackers got in.
BOTS v1 is Splunk’s Boss of the SOC dataset, and this run was the whole APT scenario: web scanning, a Joomla brute force, a malware upload, defacement, and OSINT pivots, all inside one Splunk index.
The investigation
Sourcetypes first
Before touching a question I ran index=* with event sampling at 100 to see what I was actually working with. Two things worth remembering from that survey: the Windows security log (WinEventLog:Security) is the single biggest source at 142,581 events (42.661%), and the same dataset appears under different sourcetype names depending on which table you read (the FortiGate traffic is fgt_traffic, the UTM detections are fgt_utm, Suricata shows up as both /var/log/suricata/eve.json and plain suricata).
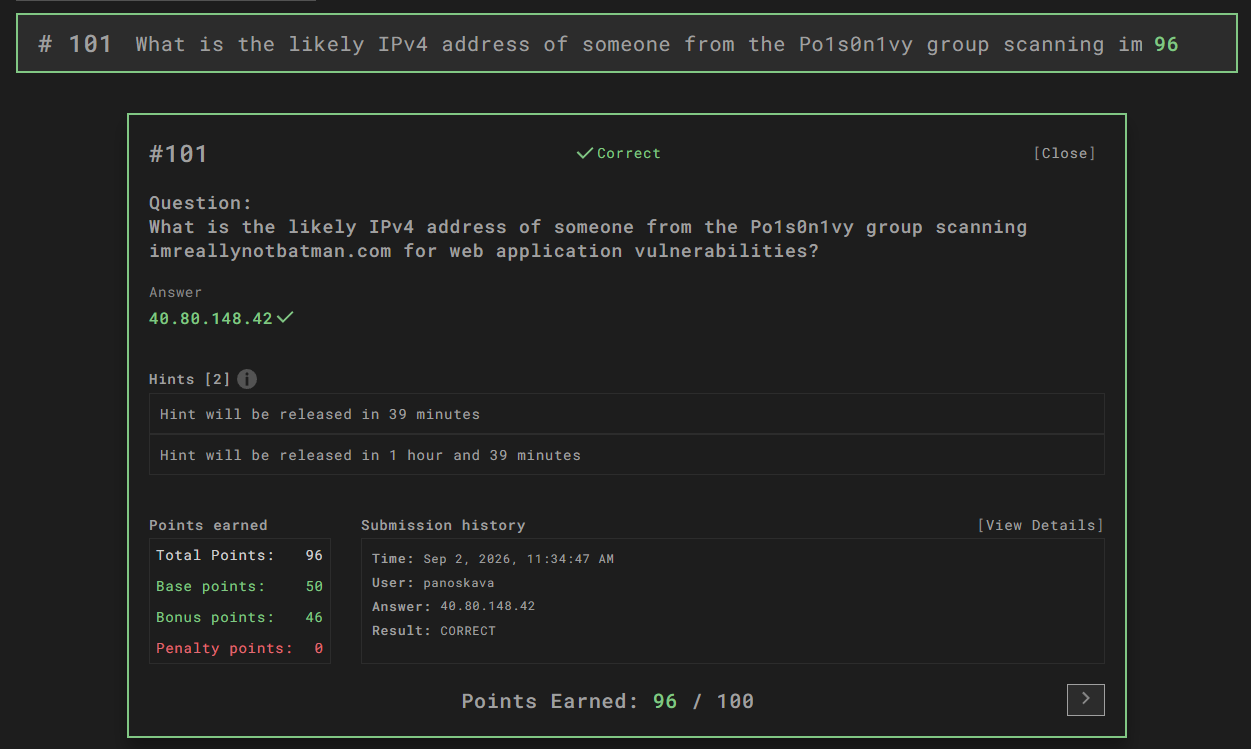
#101: the scanning IP
Question. What is the likely IPv4 address of someone from the Po1s0n1vy group scanning imreallynotbatman.com for web application vulnerabilities?
Answer: 40.80.148.42
How I got there. I searched the domain and counted requests per source IP. One address towers over the rest, and the row the lab marks as the answer is right at the top.
index="botsv1" sourcetype="fgt_utm"
| stats count by src, dst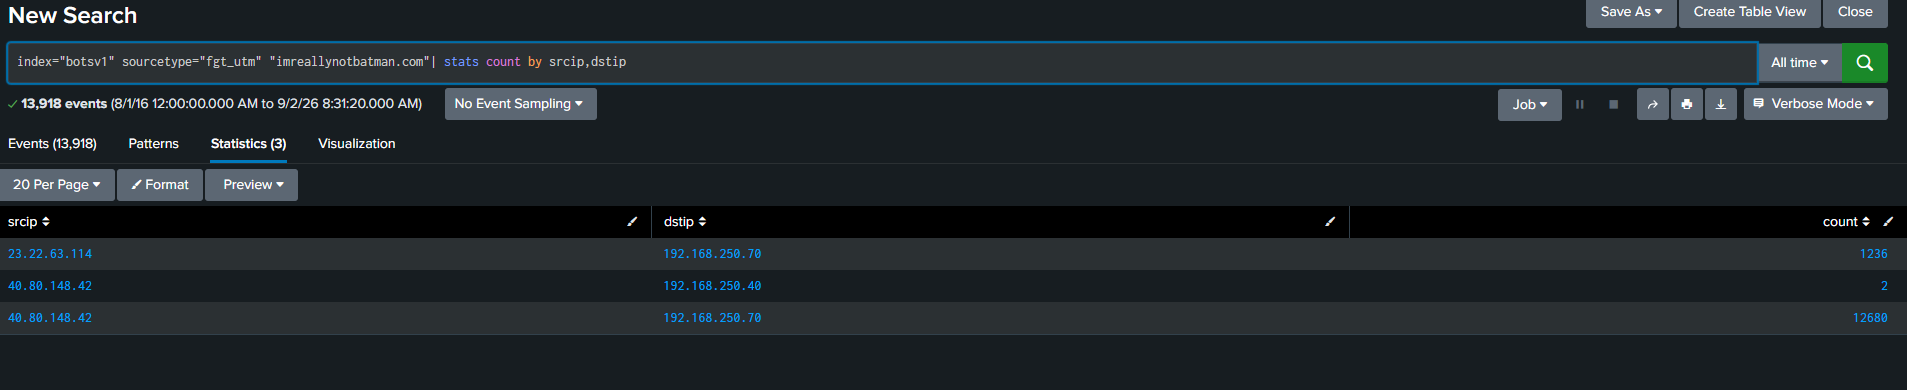
#102: who wrote the scanner
Question. What company created the web vulnerability scanner used by Po1s0n1vy? Type the company name.
Answer: Acunetix
How I got there. My first instinct was the Suricata alerts, since an IDS usually names the scan it sees.
index="botsv1" sourcetype="suricata" src_ip="40.80.148.42" event_type=alert
| stats count by alert.action, alert.category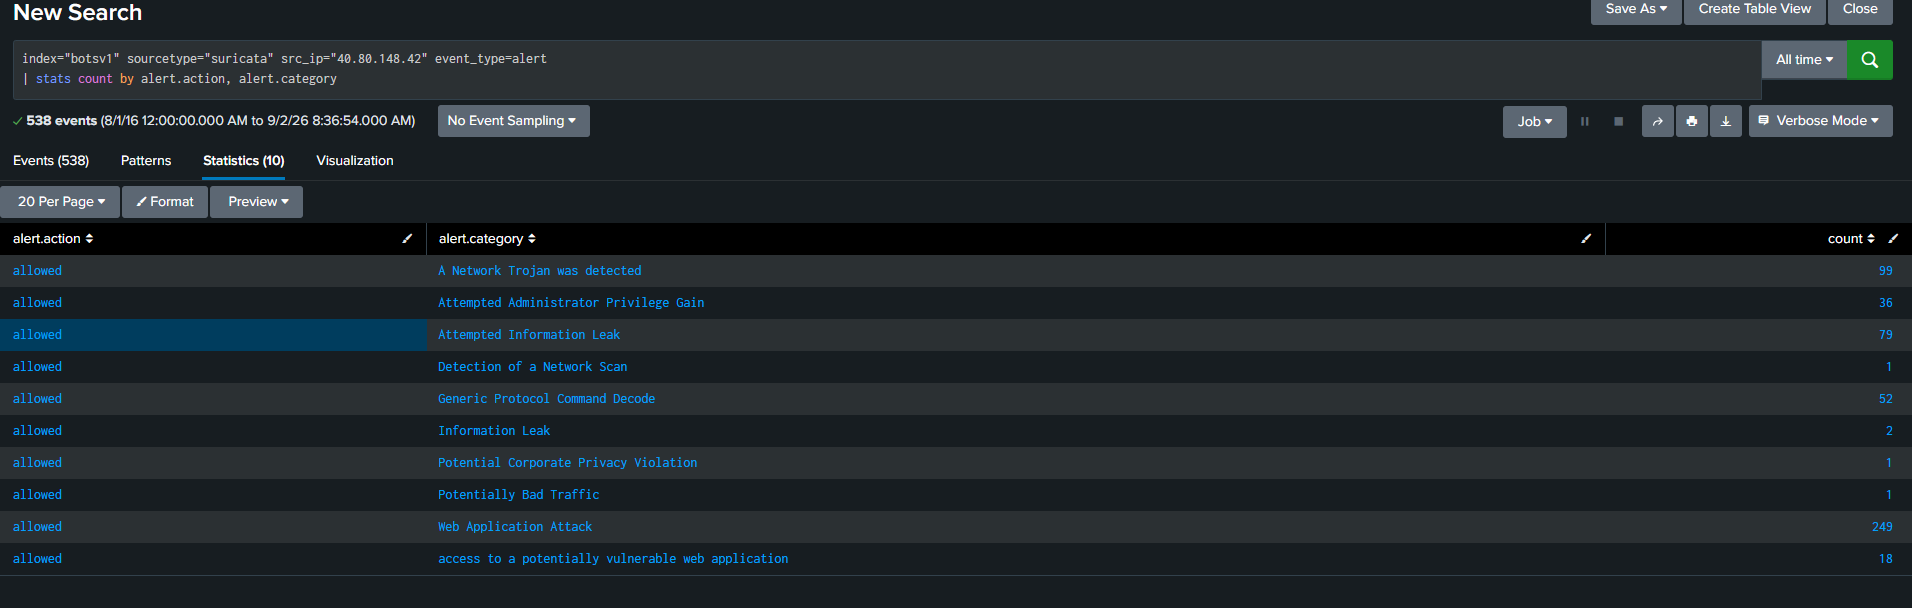
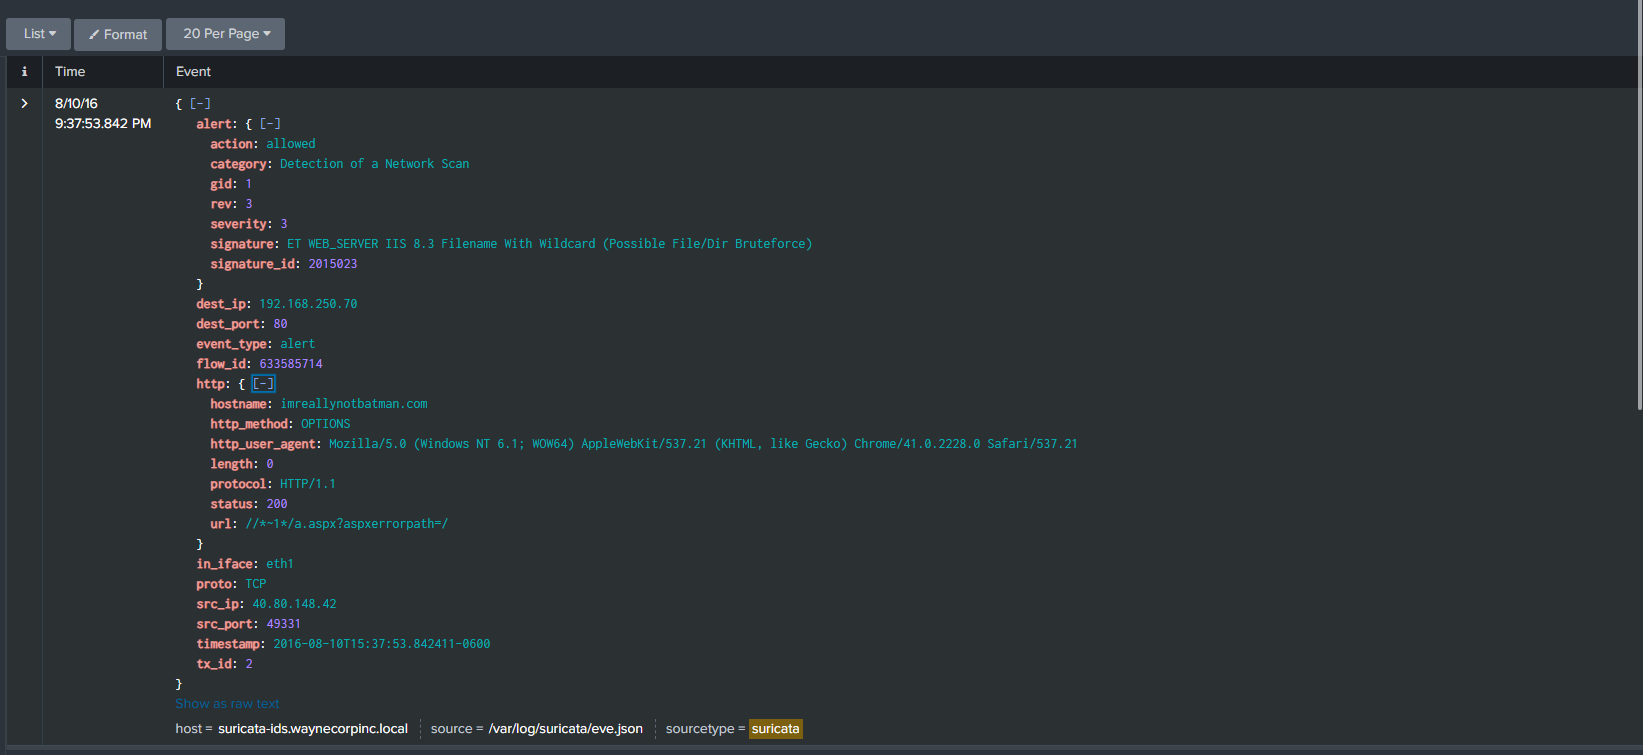
Only one category mattered, so I drilled into it and opened one of the alert events. That told me what kind of traffic had tripped the signature (requests to /joomla/index.php/component/search/), but not who wrote the tool.
Backtrack, then. HTTP streams record what the client actually sent, and the user agent usually gives the scanner away.
index="botsv1" src_ip="40.80.148.42" sourcetype="stream:http"
| stats count by http_user_agent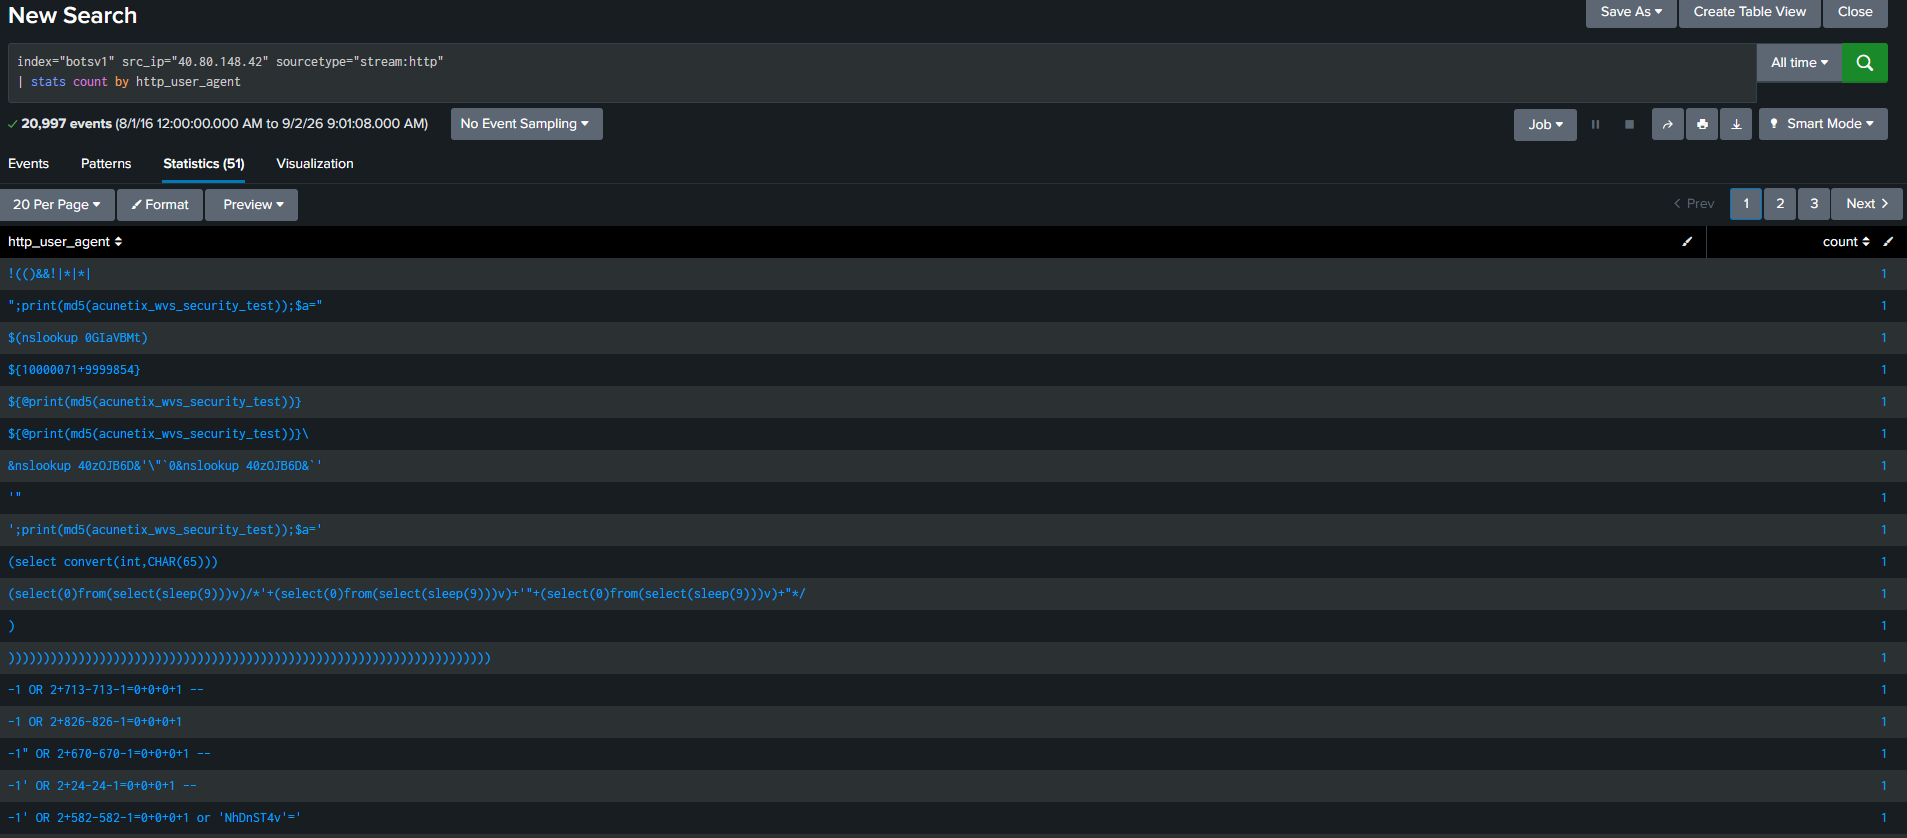
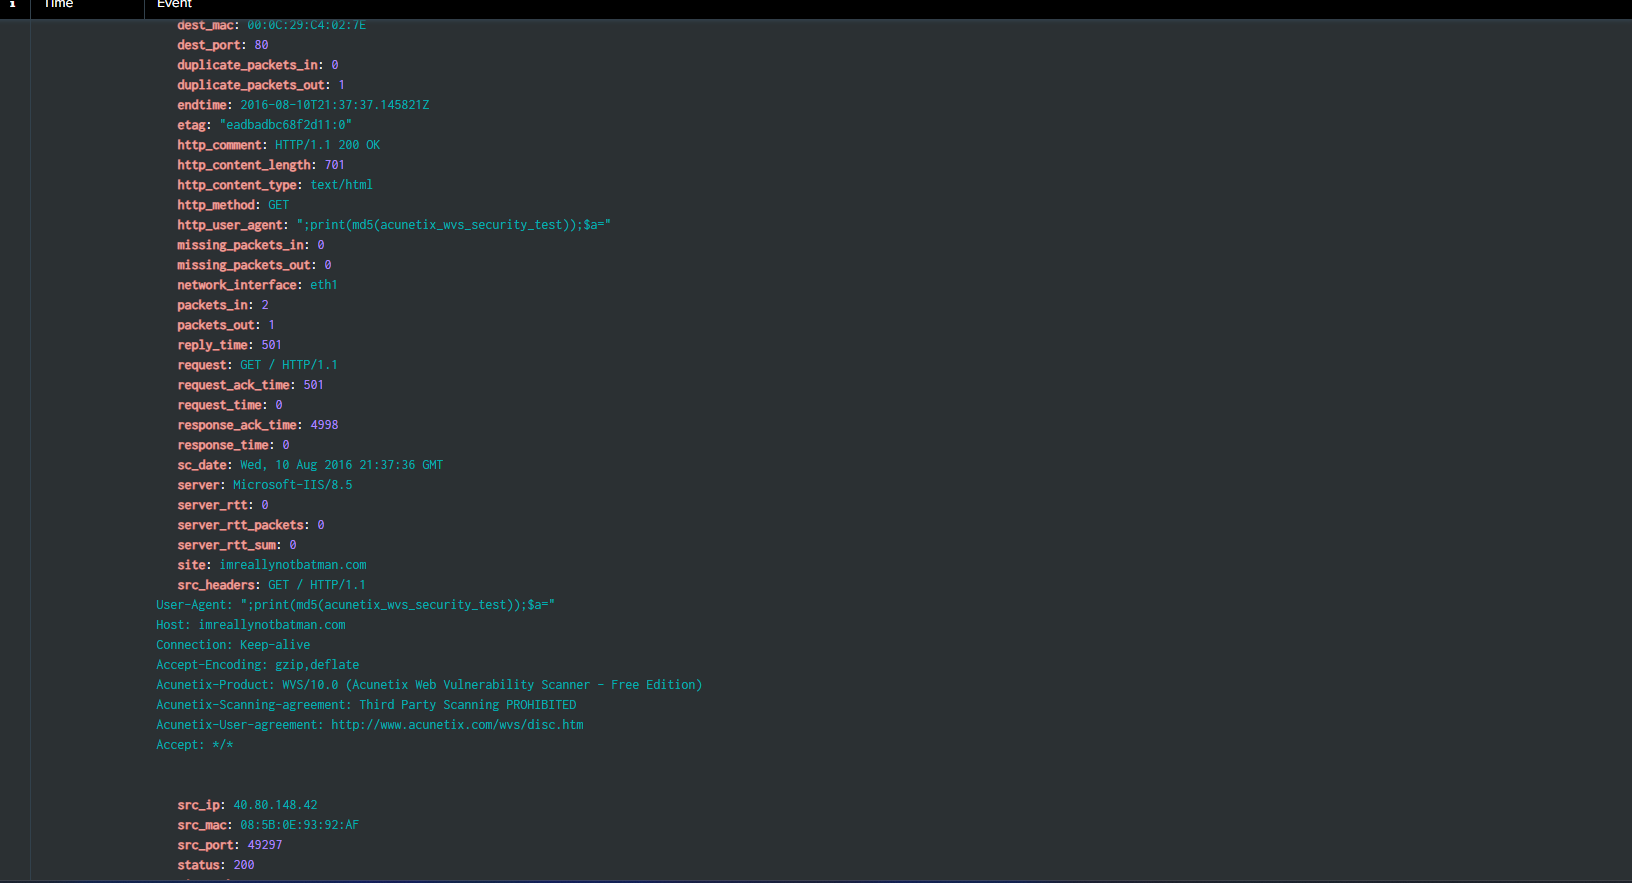
The counts already point at Acunetix, and the raw request settles it. Inside
src_headers the client sends a User-Agent: Acunetix Web Vulnerability Scanner 7.0 plus a small stack of X-Scan-Matcher, X-Scan-Query, X-Request-By
headers that no browser would ever add.
#103: the CMS behind the site
Question. What content management system is imreallynotbatman.com likely using? (Alpha characters only.)
Answer: Joomla
How I got there. This one tricked me. My instinct was to look at the HTML source again, which I did, and I did not think of Joomla as a CMS at the time. I read the word as a username or something and moved on. The hint (look at successful GETs from the scanning IP and inspect the URL fields) fixed it:
index="botsv1" sourcetype=stream:http c_ip="40.80.148.42" dest_ip="192.168.250.70" status=200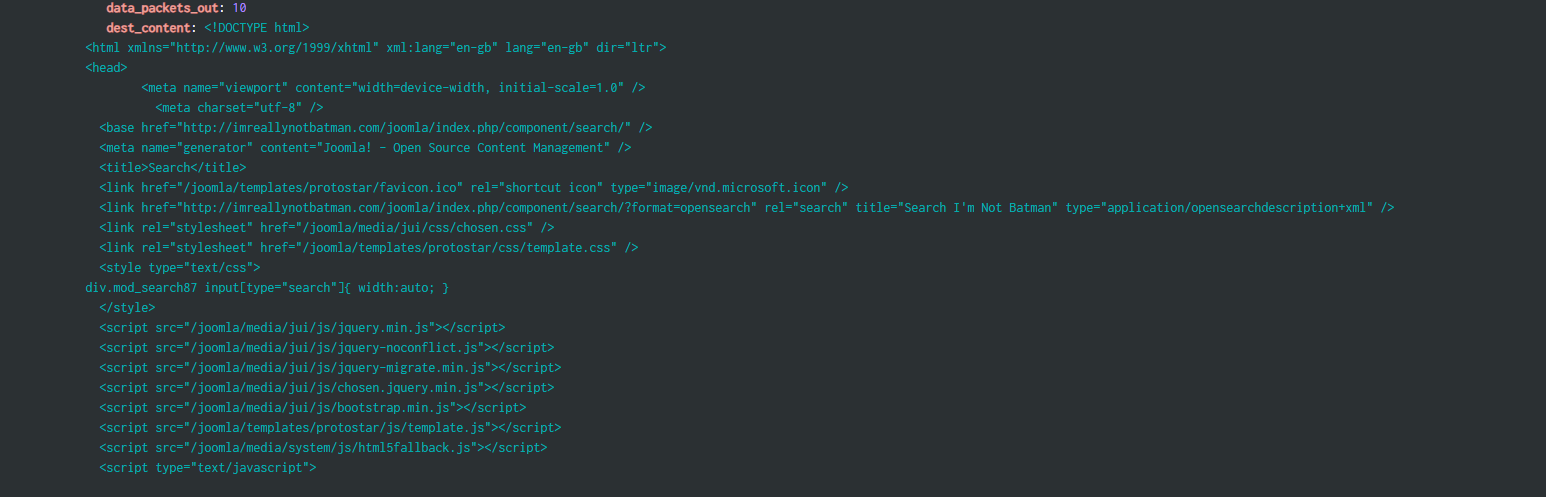
Every successful path the scanner touched sits under /joomla/, and the CMS
names itself in the directory structure.
#104: the defacement file
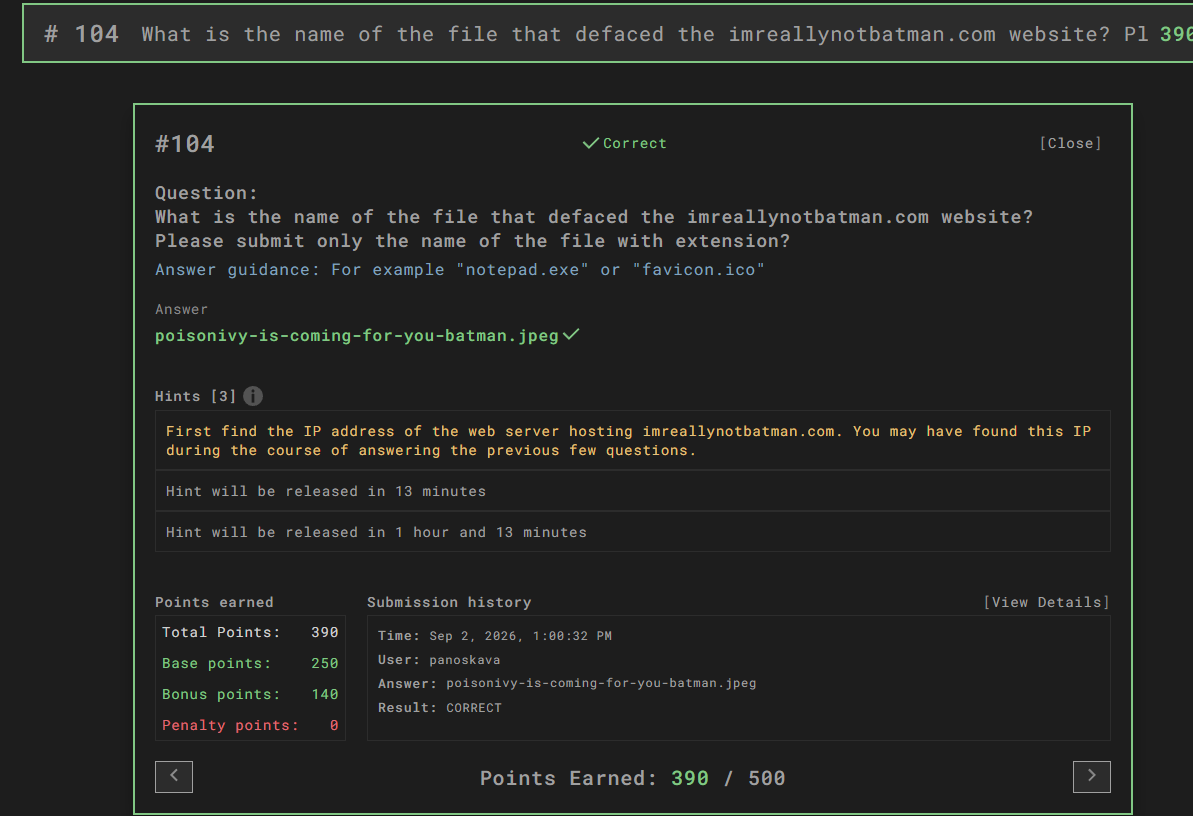
Question. What is the name of the file that defaced the imreallynotbatman.com website? (Name with extension.)
Answer: poisonivy-is-coming-for-you-batman.jpeg
How I got there. This was a lot easier than I was making it. I tried grouping POST requests and analyzing uploads first. The defacement works the other way: the compromised web server pulls the attacker’s image, so the file shows up in the server’s own GET traffic.
index="botsv1" sourcetype="stream:http" src_ip="192.168.250.70"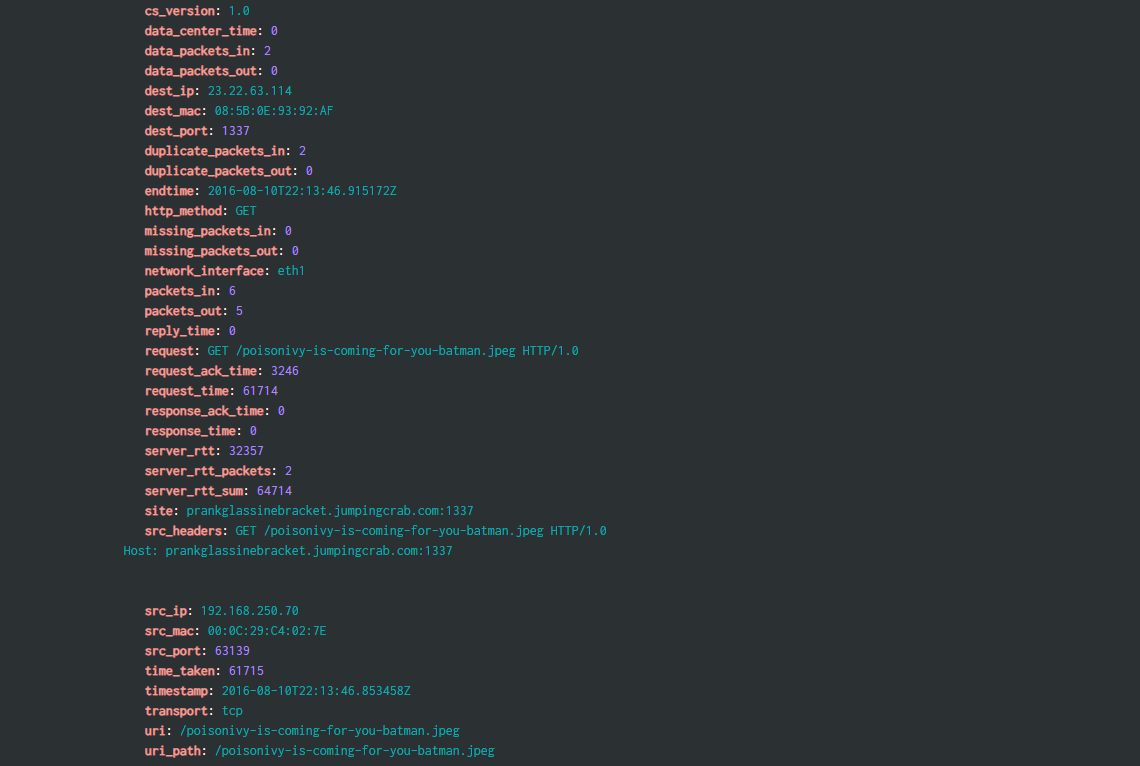
#105: the dynamic DNS FQDN
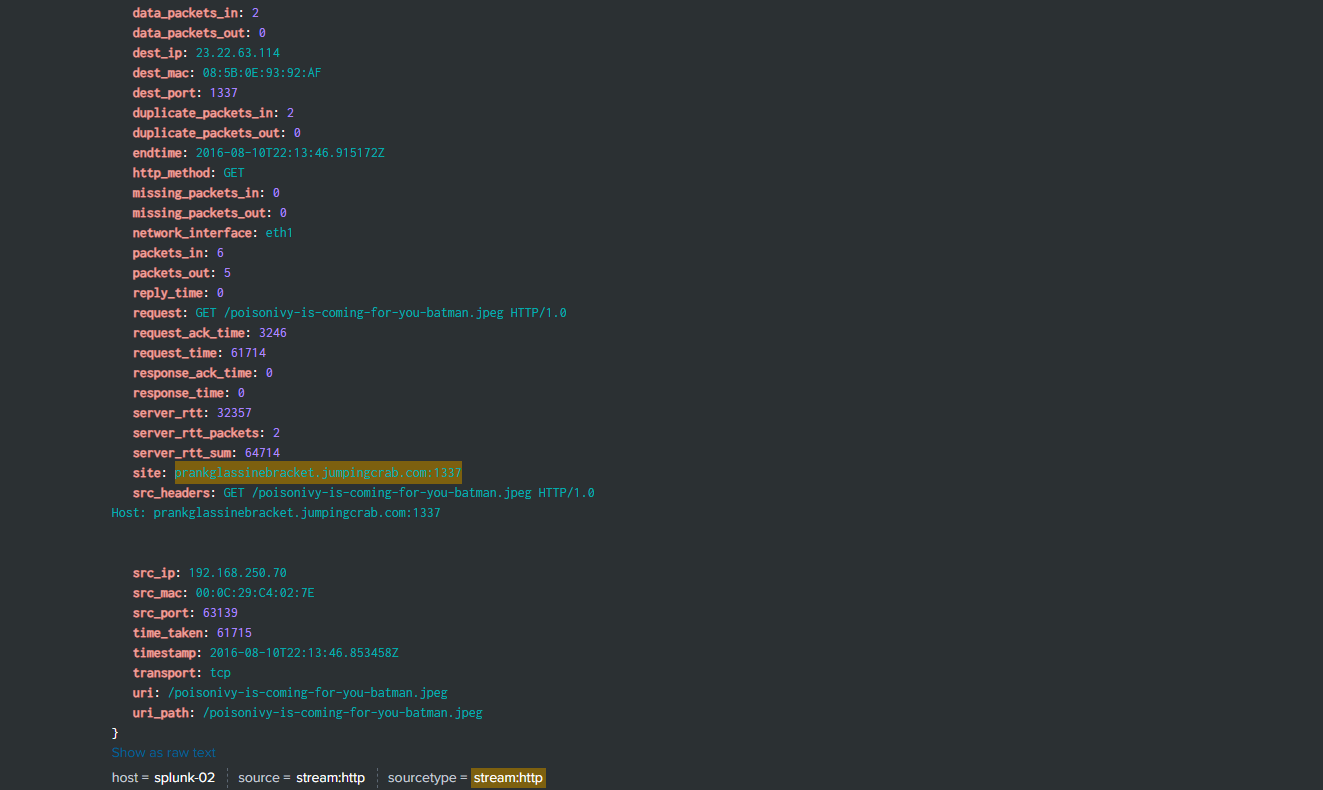
Question. This attack used dynamic DNS to resolve to the malicious IP. What fully qualified domain name (FQDN) is associated with this attack?
Answer: prankglassinebracket.jumpingcrab.com
How I got there. The same request that carried the defacement file records the full hostname, because the client had to resolve it before connecting.
#106: the pre-staged attack IP
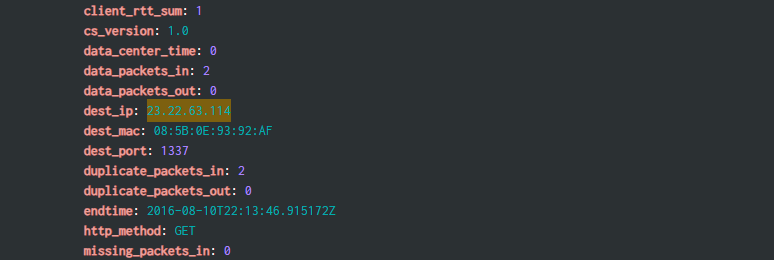
Question. What IPv4 address has Po1s0n1vy tied to domains that are pre-staged to attack Wayne Enterprises?
Answer: 23.22.63.114
How I got there. Same http log again: the defacement event shows the web server pulling the image from that address, so it is the infrastructure behind the attacker’s staging.
#108: the brute force source
Question. What IPv4 address is likely attempting a brute force password attack against imreallynotbatman.com?
Answer: 23.22.63.114
How I got there. Login attempts are POSTs to the site, so I counted POSTs per source:
index="botsv1" sourcetype="stream:http" http_method=POST imreallynotbatman.com
| stats count by src_ip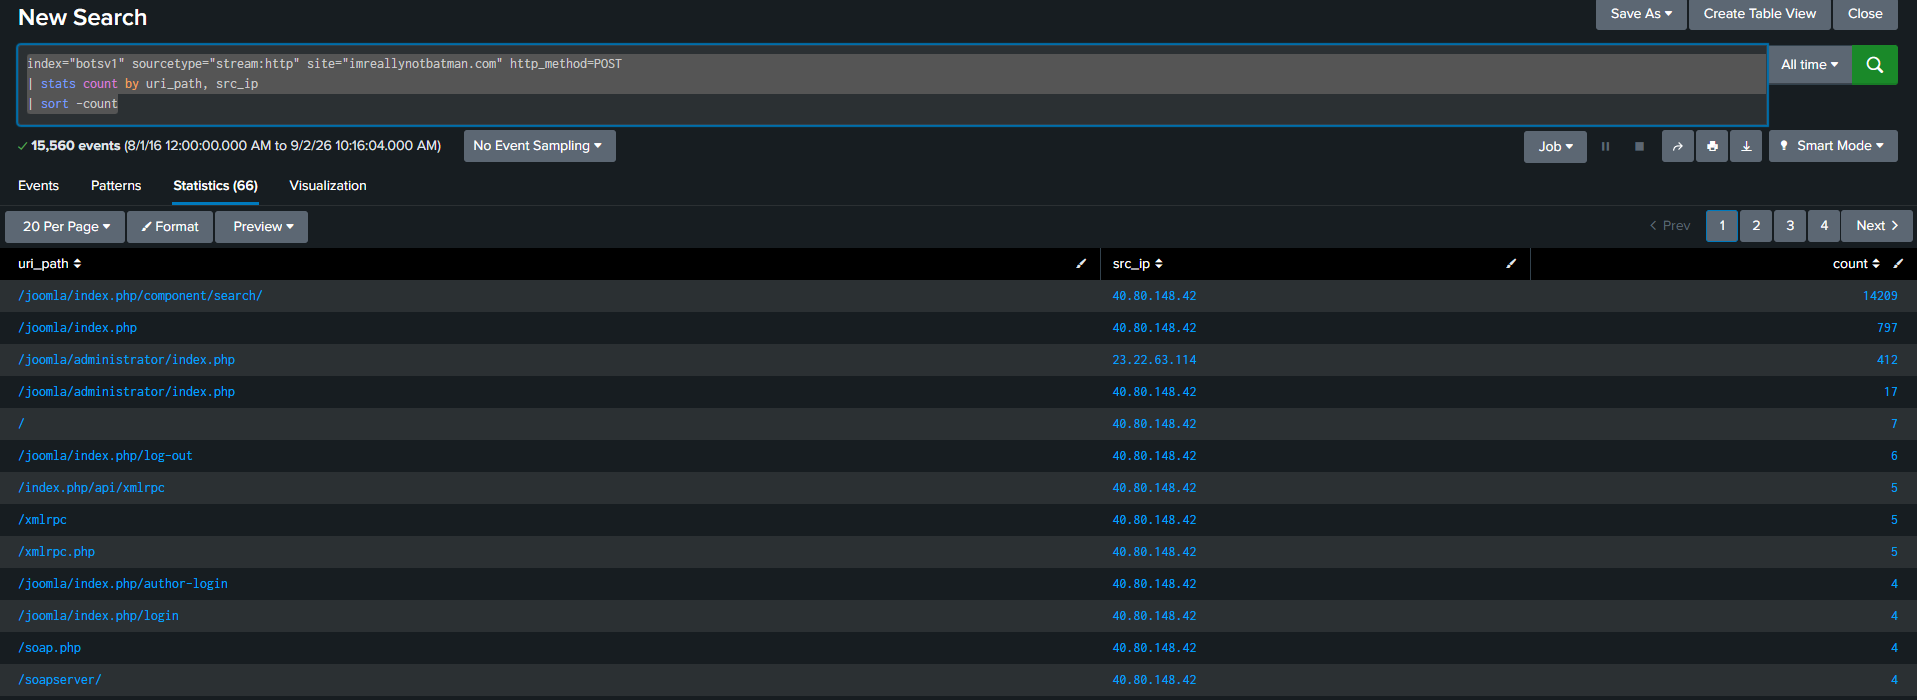
#109: the uploaded executable
Question. What is the name of the executable uploaded by Po1s0n1vy? (Include the extension.)
Answer: 3791.exe
How I got there. File uploads ride POST requests, so I filtered POSTs containing an executable extension:
index="botsv1" sourcetype="stream:http" http_method=POST "*.exe"
An upload by itself does not prove execution, so I checked Sysmon process creation events for the same file:
index="botsv1" sourcetype="xmlwineventlog:microsoft-windows-sysmon/operational" EventCode=1 "3791.exe"
| table host, User, Image, CommandLine, ParentImage, ParentCommandLine, ProcessId, ParentProcessId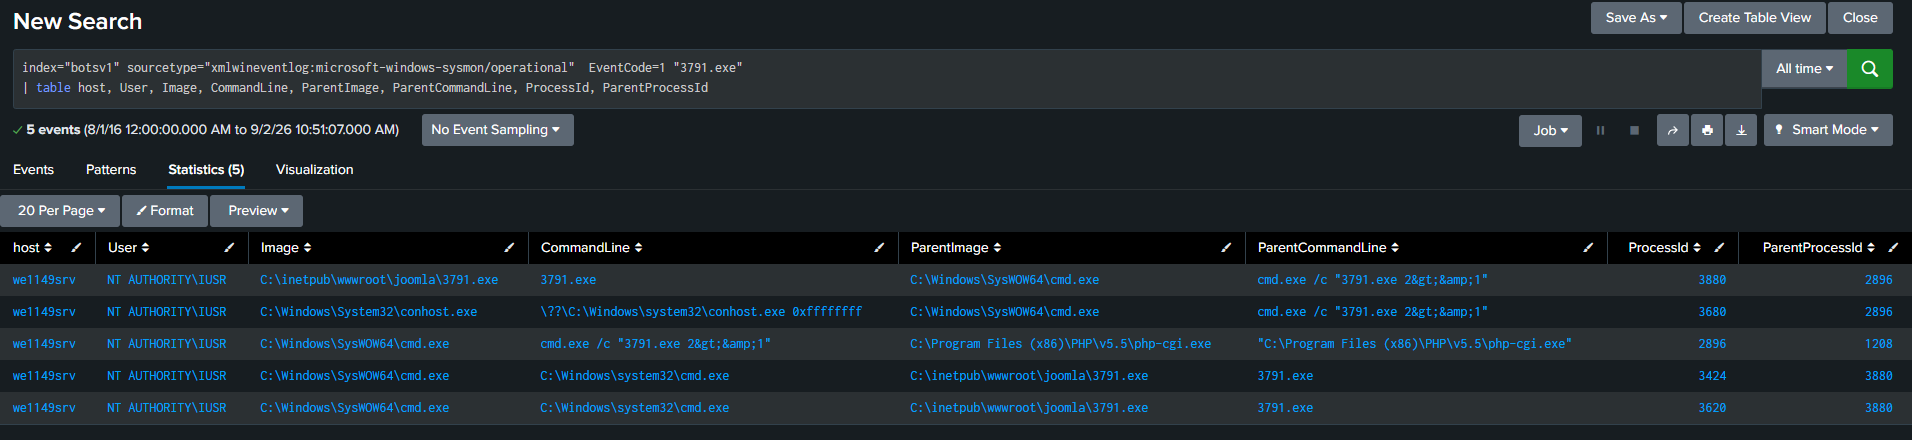
#110: the MD5
Question. What is the MD5 hash of the executable uploaded?
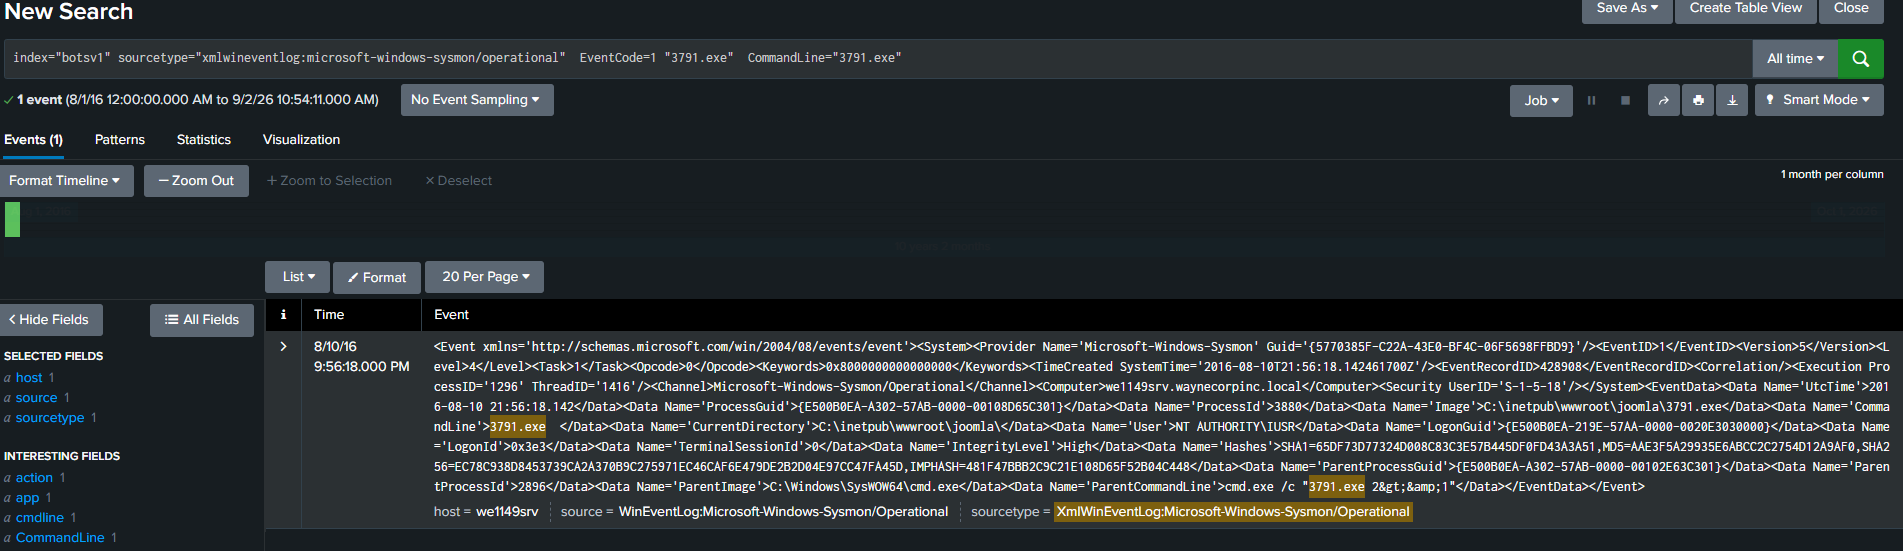
Answer: AAE3F5A29935E6ABCC2C2754D12A9AF0
How I got there. The hint says it plainly: you cannot calculate a hash from the stream event, you have to find the file in a source that records hashes. Sysmon logs them on process creation, so I opened one of the EventCode 1 events and expanded the raw XML.
#111: the spear phishing payload
Question. GCPD reports that if Po1s0n1vy’s initial compromise fails, they send a spear phishing email with custom malware attached, connected to their initial attack infrastructure. Provide the SHA256 hash of this malware.
Answer: 9709473ab351387aab9e816eff3910b9f28a7a70202e250ed46dba8f820f34a8
How I got there. This one lives outside Splunk entirely. The hint points at the IP we already have, so I searched ThreatMiner for 23.22.63.114, pulled the sample hashes associated with it, and checked them on VirusTotal until one came back as actual malware.
#112: the hidden message
Question. What special hex code is associated with the customized malware discussed in question 111? (It’s not in Splunk!)
Answer: 53 74 65 76 65 20 42 72 61 6e 74 27 73 20 42 65 61 72 64 20 69 73 20 61 20 70 6f 77 65 72 66 75 6c 20 74 68 69 6e 67 2e 20 46 69 6e 64 20 74 68 69 73 20 6d 65 73 73 61 67 65 20 61 6e 64 20 61 73 6b 20 68 69 6d 20 74 6f 20 62 75 79 20 79 6f 75 20 61 20 62 65 65 72 21 21 21
How I got there. The VirusTotal community tab on the sample from the last question. Somebody posted the hex string as a comment on the file’s page.
#114: the first password tried
Question. What was the first brute force password used?
Answer: 12345678
How I got there. Same POST traffic from the brute force IP, sorted by time:
index="botsv1" sourcetype="stream:http" src_ip="23.22.63.114" http_method=POST
| sort _time
| head 10
| table _time, form_data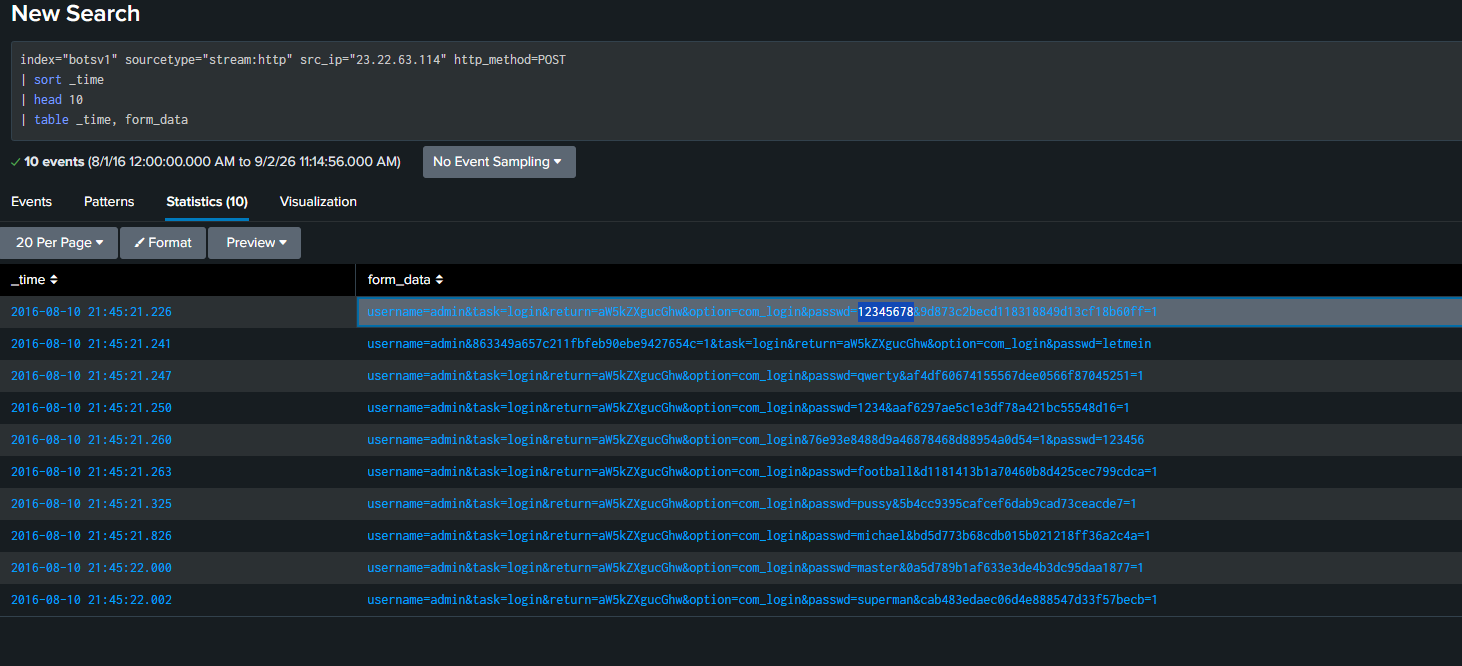
#115: the Coldplay song
Question. One of the passwords in the brute force attack is James Brodsky’s favorite Coldplay song. We are looking for a six character word. Which is it?
Answer: yellow
How I got there. After writing a query that pulls the password out of form_data with rex, the song list practically answers itself:
index="botsv1" sourcetype="stream:http" src_ip="23.22.63.114" http_method=POST uri_path="/joomla/administrator/index.php"
| rex field=form_data "(?<password>(?<=passwd=)[^&]+)"
| lookup coldplay.csv song AS password OUTPUT song AS matched_song
| where isnotnull(matched_song)
| stats count by password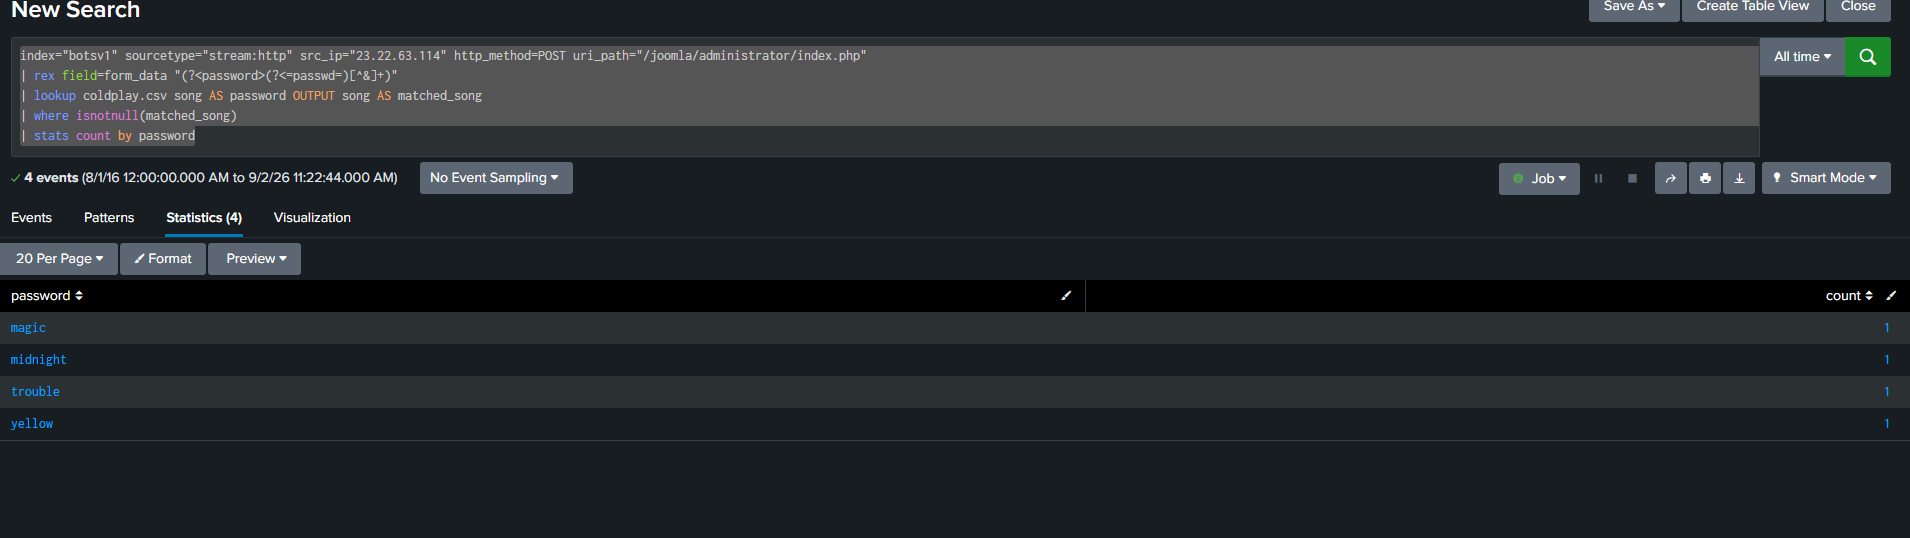
#116: the correct password
Question. What was the correct password for admin access to the content management system running “imreallynotbatman.com”?
Answer: batman
How I got there. The brute force was hundreds of failures. The correct password is the attempt that got a 302 redirect back instead of the login page again, so I looked for the POST that did not fail:
index="botsv1" sourcetype="stream:http" src_ip="23.22.63.114" http_method=POST status=302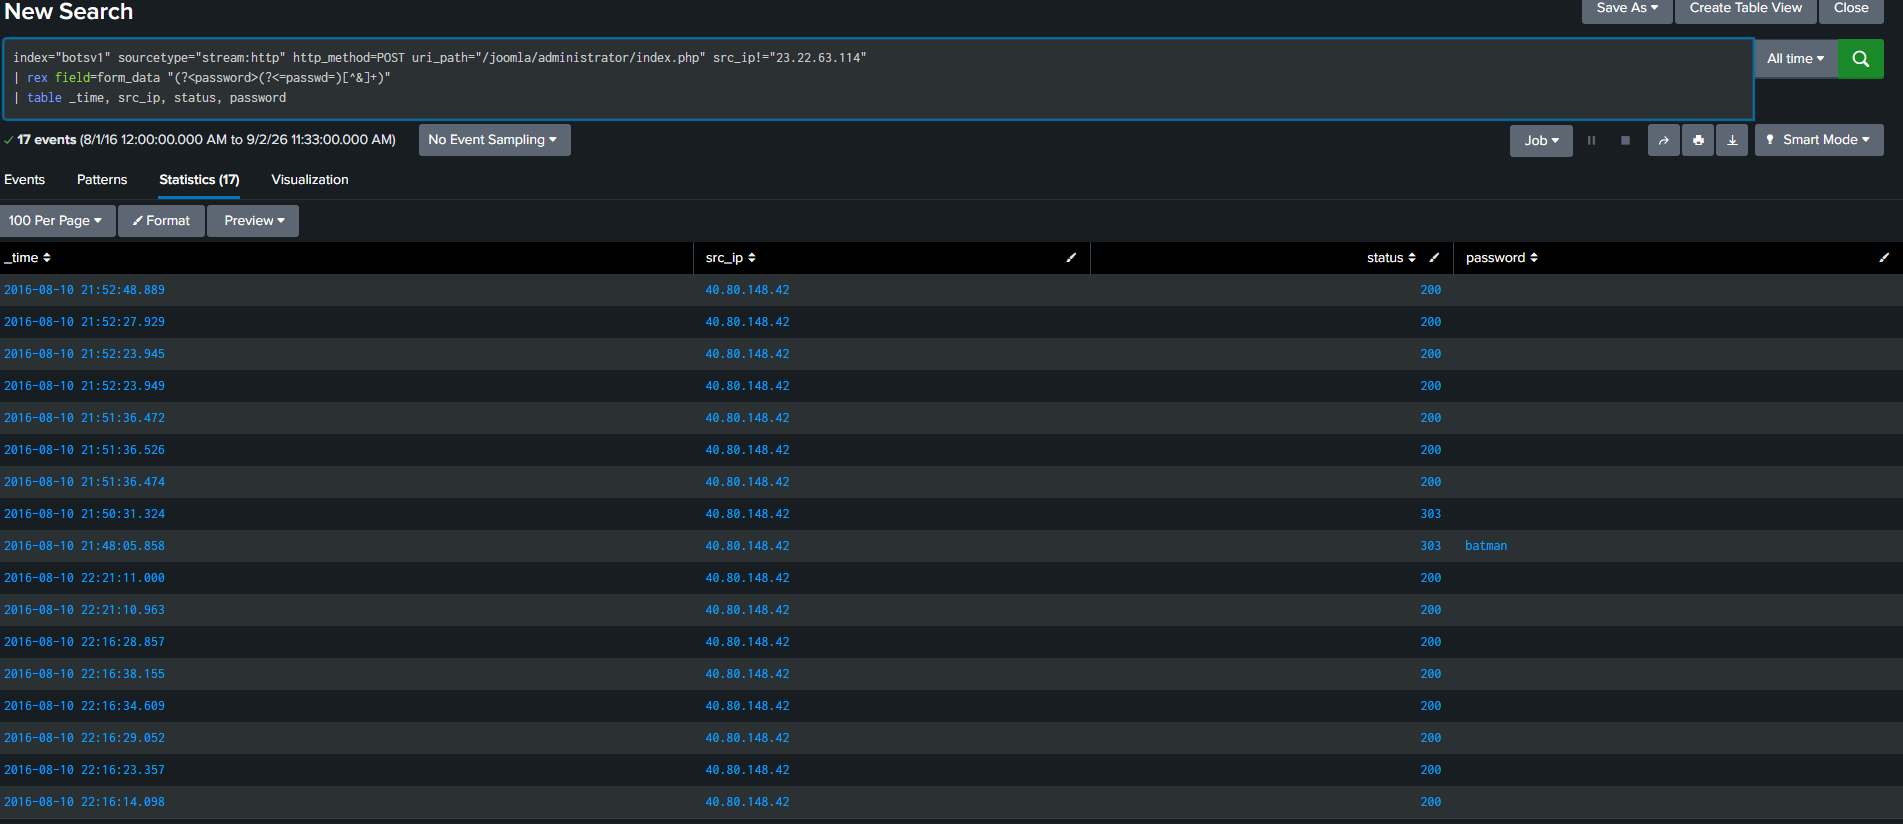
#117: average password length
Question. What was the average password length used in the password brute forcing attempt? (Round to the closest whole integer.)
Answer: 6
How I got there. The field extraction from #115 keeps paying off. Feed every extracted password through eval and average the lengths:
index="botsv1" sourcetype="stream:http" src_ip="23.22.63.114" http_method=POST uri_path="/joomla/administrator/index.php"
| rex field=form_data "(?<password>(?<=passwd=)[^&]+)"
| eval length=len(password)
| stats avg(length)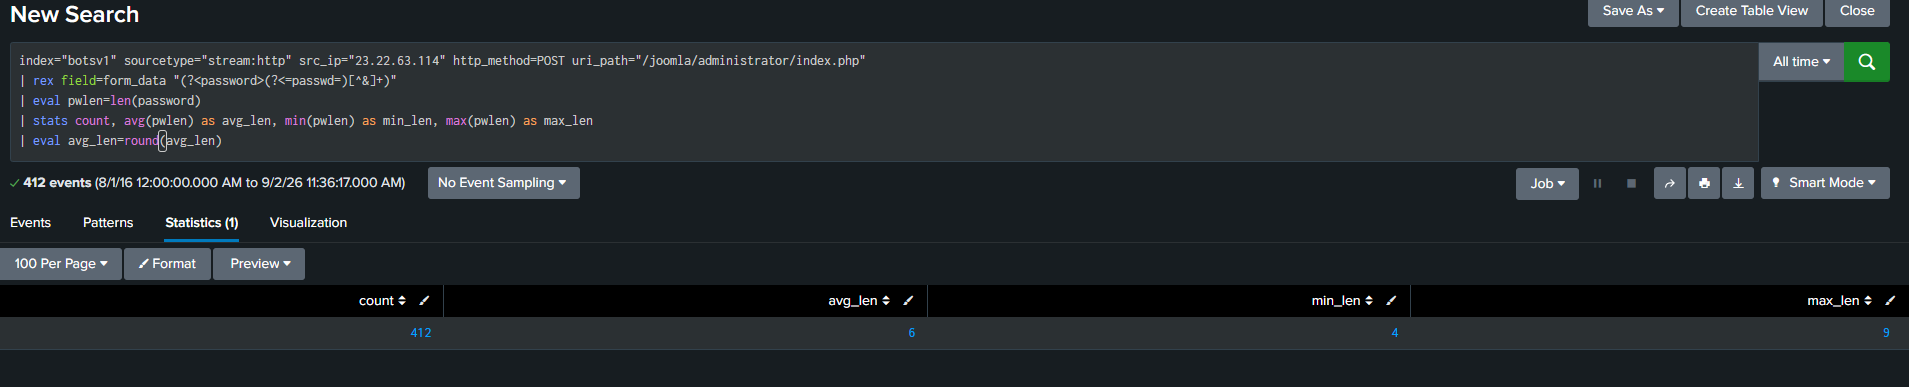
What this lab really tests
Whether you can move sideways through a SIEM. Almost nothing here requires a query you could not write in the first hour of learning SPL; what the lab actually grades is choosing the right sourcetype for each question, and knowing when the answer is not in the SIEM at all. The scanner lives in HTTP headers, the hash lives in Sysmon, the spear phishing payload lives on ThreatMiner. An analyst who only knows one log type per protocol gets stuck at exactly the questions that separate BOTS from a tutorial.
Skills and techniques
- Splunk SPL:
stats count by,sort _time,rexfield extraction,lookup,where isnotnull(),eval len() - Sourcetype selection:
stream:http,fgt_utm,suricata,XmlWinEventLog:Microsoft-Windows-Sysmon/Operational - Host telemetry: Sysmon EventCode 1 (process creation) for hash and parent-child process evidence
- OSINT pivots: ThreatMiner (passive DNS, sample hashes), VirusTotal (verdicts and the community tab)
- MITRE ATT&CK: T1110 (Brute Force), T1505.003 (Web Shell), T1190 (Exploit Public-Facing Application)